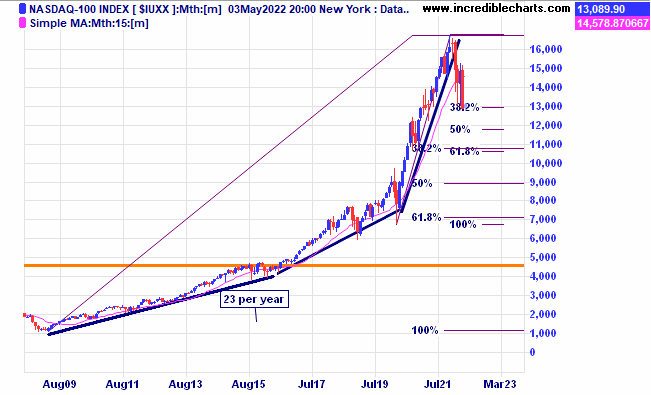
Sell in May and go away looks to have started a month early in US markets with the tech heavy Nasdaq down 24 per cent at the lowest point so far and is just resting on the 38 per cent Fibonacci retracement zone. A correction was inevitable at some point with the average yearly gains running at more than 50 per cent since the 2020 lows. Will April showers bring May flowers?

A monthly chart of the Nasdaq shows the Fibonacci retracement zones for the ranges from the 2020 and 2009 lows.
This weekly chart of the local index shows a lot more strength than the US as we sit above pre-Covid levels. Strong commodity prices have certainly helped our big mineral and energy exporters. Strong resistance with three tops around the same level could signal more sideways or even lower price action. We remain open to shorting the market if the right opportunity is presented.

US rate hike cycles versus share market gains.

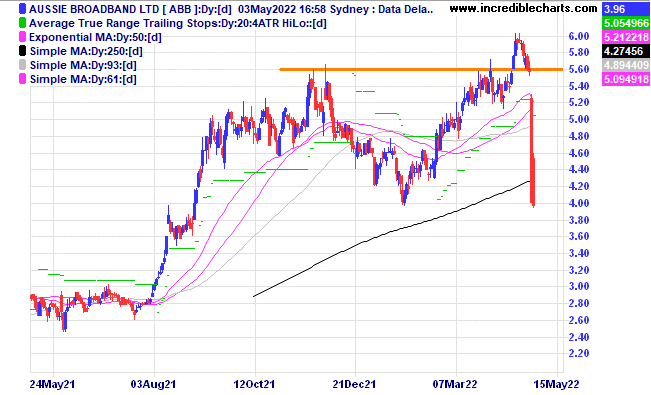
A recent buy Aussie Broadband had a negative update and fell heavily through our stop and we sold for a big loss. It happens and is one reason why we have a diversified portfolio.
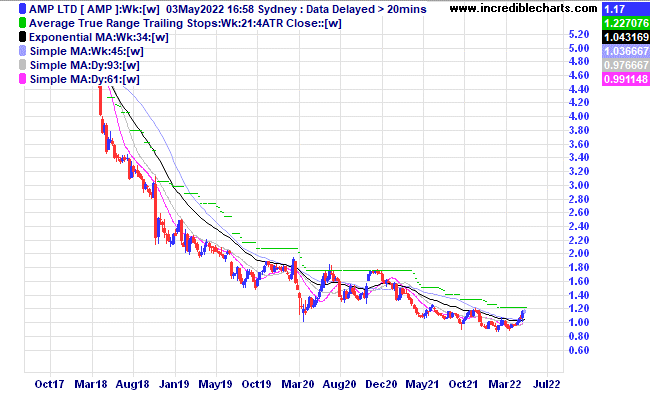
Long suffering AMP shareholders could be in for some capital returns after a successful sale of real estate assets.
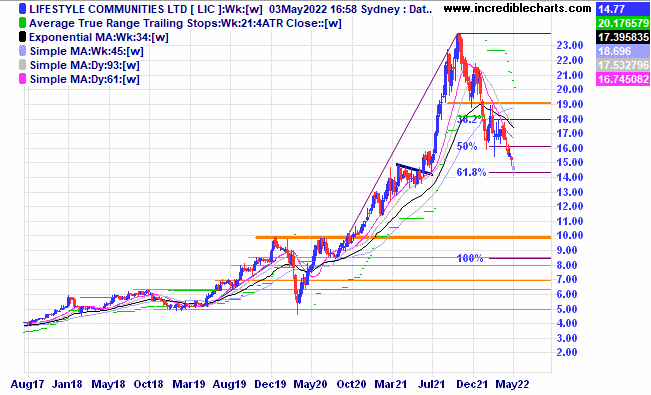
Lifestyle Communities is a long way from the highs.
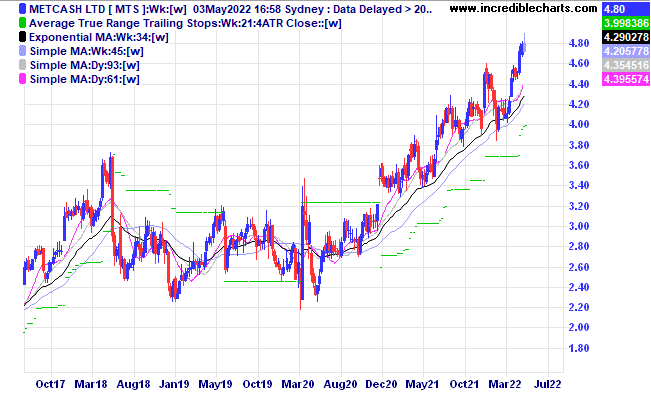
Metcash has made a fresh high.
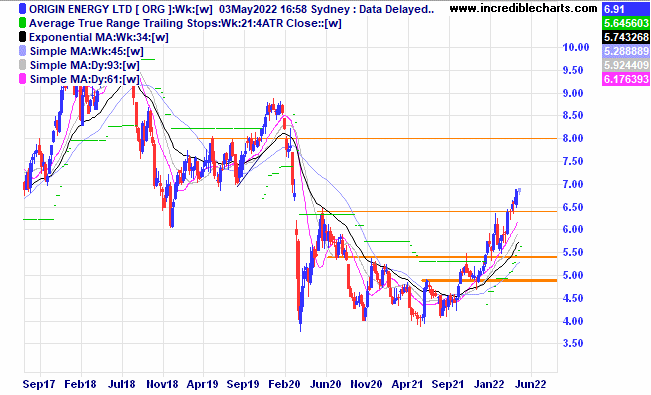
Origin Energy has formed a nice-looking basing pattern.
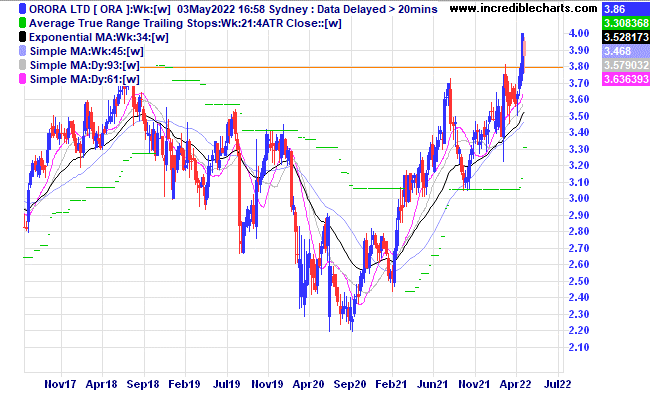
Orora has recently broken up through resistance.
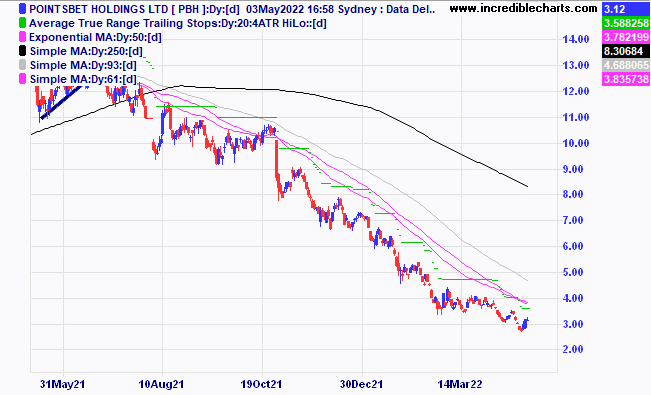
Pointsbet Holdings has recently posted some encouraging signs of growth and could be a turnaround candidate.
KLS has moved up above recent resistance and we bought a parcel today for the educational portfolio.

Table
Security | Units bought (sold) | Date | Open price/ From last table | Current/close | $ gain/loss |
Bought Whitehaven Coal c/f at $2.76 | Bought 700 at $2.70 | 23/12/2021 | $4.40 | $4.82 | +$294.00 |
Bought Brainchip Holdings | Bought 500 at 85c | 5/1/2022 | 91 | 93.5c | +$12.50
|
Bought Computershare | Bought 120 at $20.50 | 5/1/2022 | $24.39 | $23.90 | -$58.80 |
Bought Macquarie Group | Bought 10 at $199.00 | 9/2/2022 | $204.26 | $203.43 | -$8.30 |
Bought Red5
| Bought 5,000 at 29.5c | 9/2/2022 | 40.5c | 39.5c | -$50.00 |
Bought CSL
| Bought 12 at $260.00 | 16/2/2022 | $269.00 | $272.00 | +$36.00 |
Bought Northern Star | Bought 200 at $10.00 | 22/2/2022 | $10.17 | Sold at $9.70
| -$124.00 |
Bought Monadelphous | Bought 300 at $11.00 | 23/2/22 | $10.64 | Sold $10.30 | -$132.00 |
Bought Goodman
| Bought 100 at $22.00 | 2/3/22 | $23.55 | Sold $22.00 | -$185.00 |
Bought Syrah
| Bought 1,000 at $1.40 | 2/3/22 | $1.66 | $1.86 | +$200.00 |
Bought St Barbara
| Bought 2,000 at $1.52 | 8/3/2022 | $1.37 | $1.29 | -$160.00 |
Bought Xero
| Bought 25 at $102.00 | 17/3/2022 | $96.15 | $91.83 | -$108.00 |
Bought Imdex
| Bought 800 at $2.90 | 23/3/2022 | $2.53 | Sold at $2.50 | -$54.00 |
Bought Objective Corporation | Bought 150 at $17.20 | 23/3/2022 | $17.55 | Sold 50 at $16.00 100 left at $15.70 | -$107.50 -$185.00 |
Bought Resolute
| Bought 8,000 at 36c | 13/4/2022 | 33.5c | 34c | +$40.00 |
Bought Aussie Broadband | Bought 400 at $5.55 | 20/4/2022 | $5.75 | Stopped 2/5 at $4.40 | -$570.00 |
Bought Judo
| Bought 1,000 at $1.70 | 20/4/2022 | $1.68 | $1.64 | -$40.00 |
Bought Flight Centre
| Bought 100 at $21.80 | 20/4/2022 | $21.80 | $22.70 | +$90.00 |
Bought NDQ ETF
| Bought 50 at $29.00 | 27/4/2022 | $29.00 | $29.34 | +$17.00 |
Bought Endeavour
| Bought 250 at $7.76 | 27/4/2022 | $7.76 | $7.62 | -$35.00 |
Bought Stavely
| Bought 6000 at 40c | 27/4/2022 | 40c | 39c | -$60.00 |
|
|
|
|
|
|
Start 2/1/2022 $50,000.00 | Open balance $56,795.33 |
| |
| $56,795.33 |
| Gains/losses week -$1,188.10 |
|
|
| -$1,188.10 |
| Current total $55,607.23 |
|
|
| $55,607.23 |
Brokerage at $30 per round turn added when sold. | Buy/ close prices and Margin $35,809.80 |
|
|
| $35,809.80 |
Prices from Tuesday night or 6am for US positions. | Cash available $23,978.00 |
|
|
| $23,978.00
|
Disclaimer: The commentary and trading positions taken are for educational purposes only and are not an invitation to trade. Trading is risky and individuals should seek Professional counsel before making any financial decisions. Many thanks to Incredible Charts.com software for most of the charts used in the column.
To order photos from this page click here


