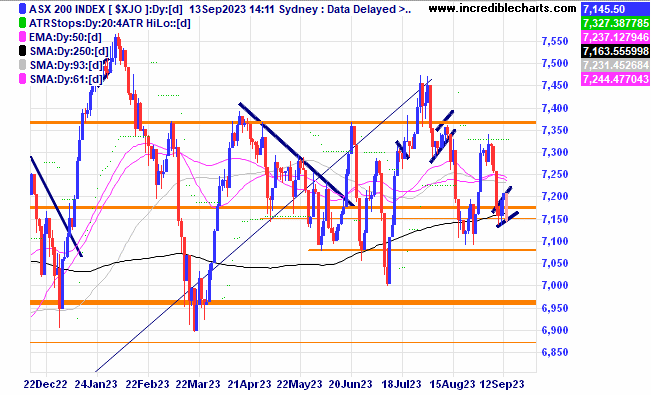
The local market looks to be forming another bearish flag pattern.
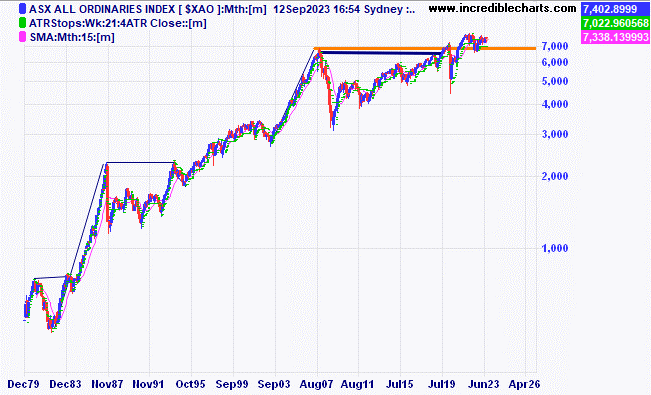
The local All Ordinaries index can remain in a sideways churn for a while and take very long periods of time to make fresh highs as shown on this monthly chart.
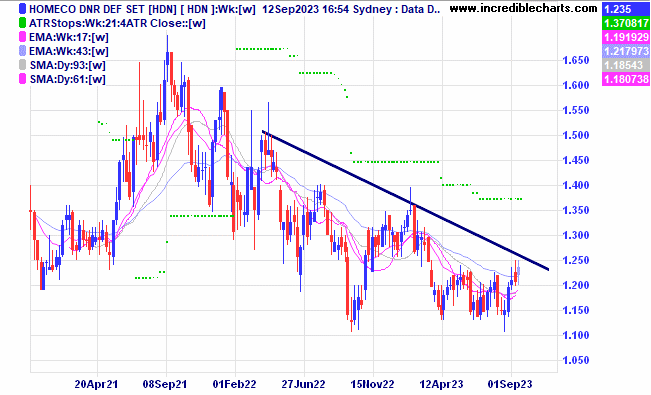
Homeco could be building a base here.
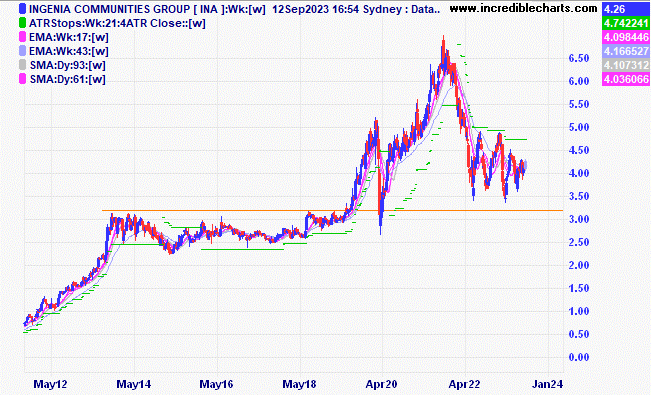
Ingenia Communities is in a sideways trading pattern.
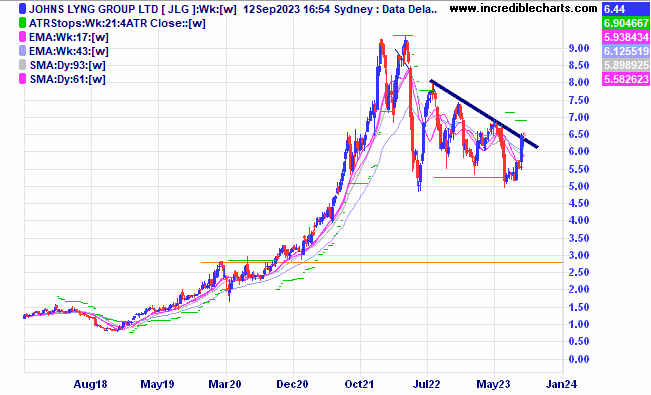
Johns Lyng Group has again bounced from support levels around $5.
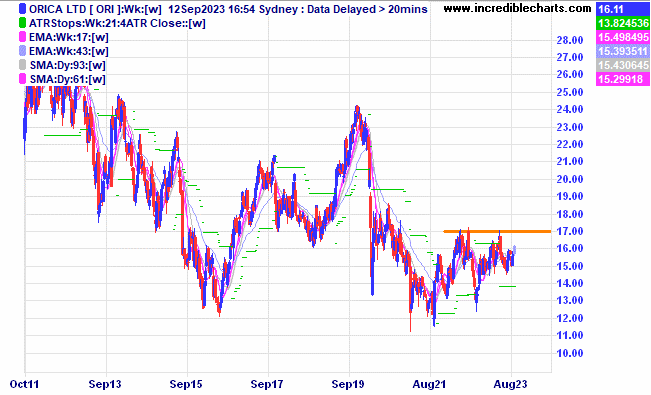
Orica is finding it tough to break through recent highs.
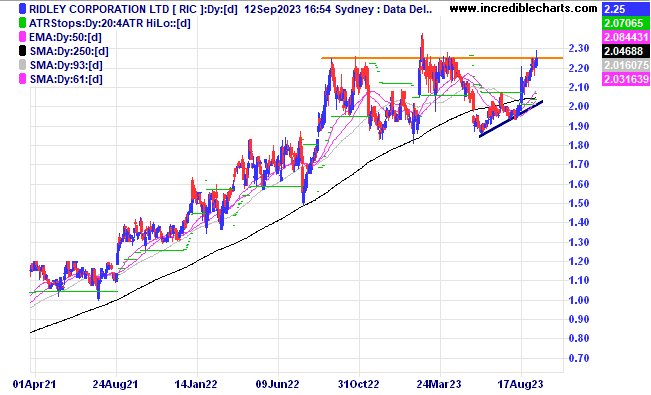
Ridley Corporation could be building for a move higher.
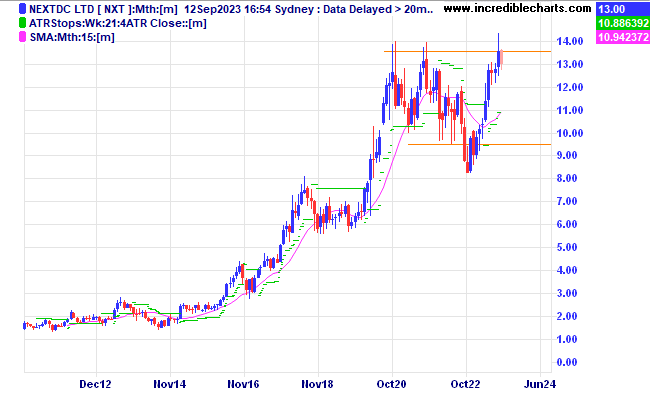
Data Centre mob NextDC made a spike higher last month.
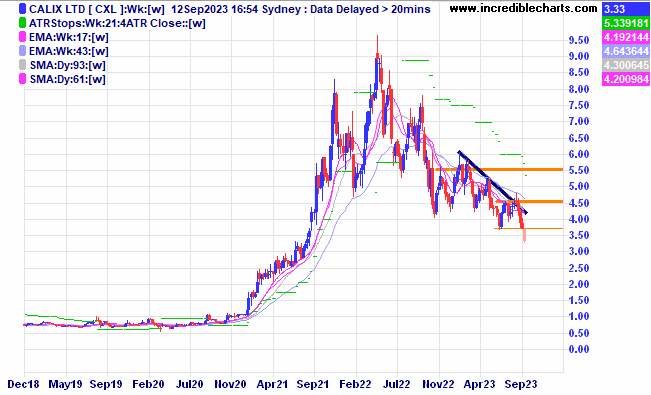
Calix looks to have breached a support level, how low can it go from here?
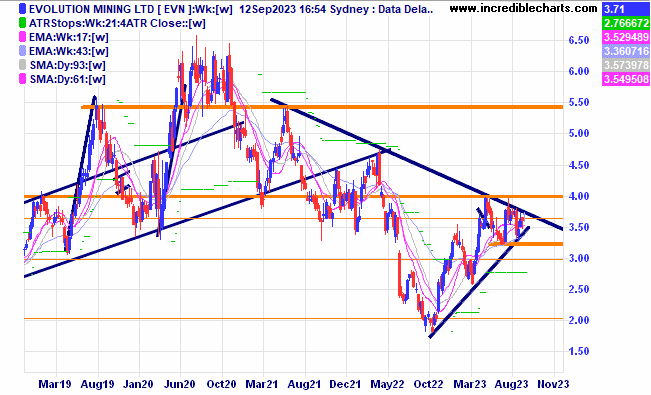
Gold miner Evolution is still stuck in a consolidation pattern.
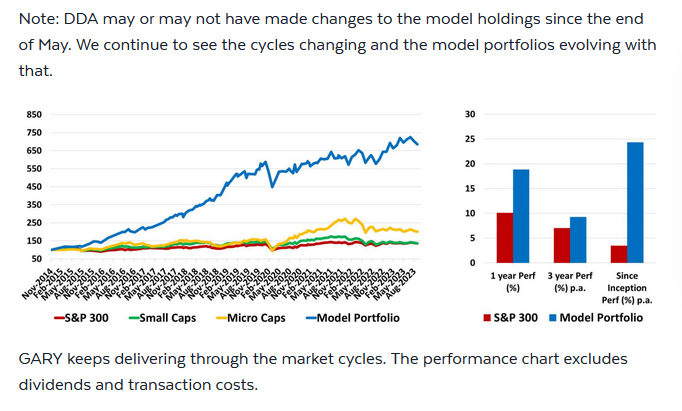
The chart of a “Growth at a reasonable yield” portfolio over the past few years. Note the recent taper off during the current sideways market.
This shows the tendency of different countries to invest in their home markets.

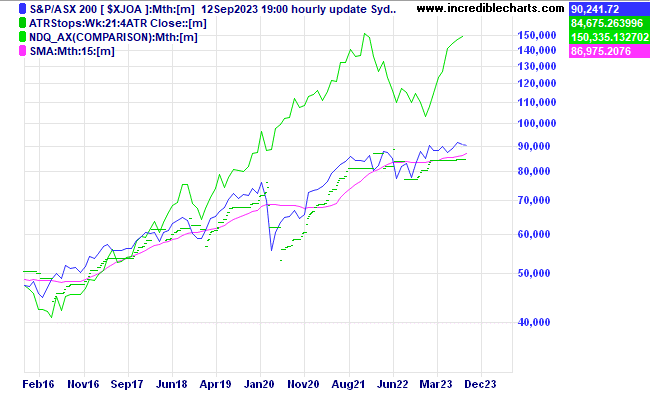
This graph shows the total returns from an ASX 200 accumulation index which gained around 85 per cent against the NDQ EFT representing the Nasdaq 100 index without including dividends which gained around 255 per cent.
Disclaimer: The commentary on different charts is for general information purposes only and is not an invitation to trade. Trading is risky and individuals should seek Professional counsel before making any financial decisions. Many thanks to Incredible Charts.com software for most of the charts used in the column.
Monitor, measure, manage and maximise… Cheers Charlie.
To order photos from this page click here


