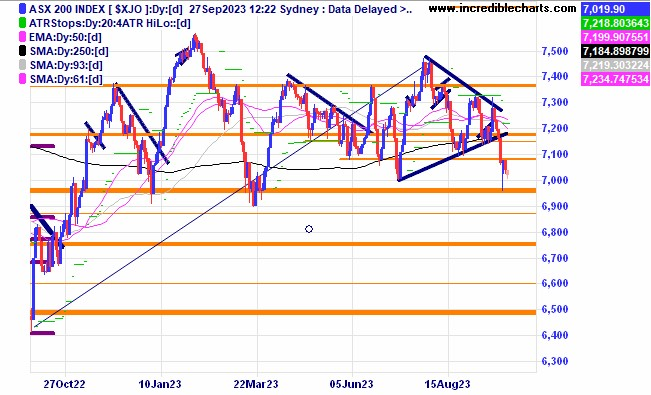
The local market moved down and out of the congestion pattern and spiked lower late last week. The market now could be making a bottoming type pattern. Time will tell.
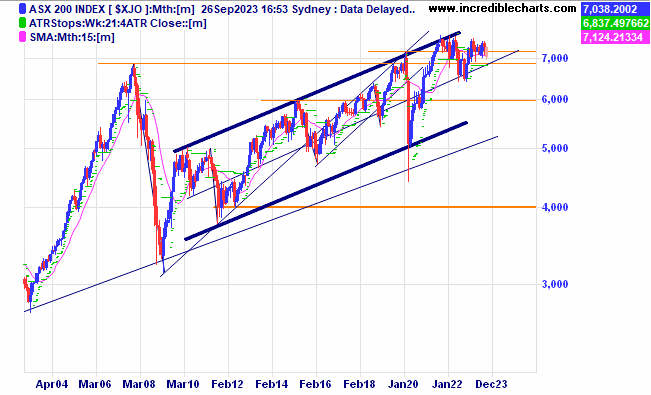
The longer-term chart for the local index shows most of the time the index is above the midline.
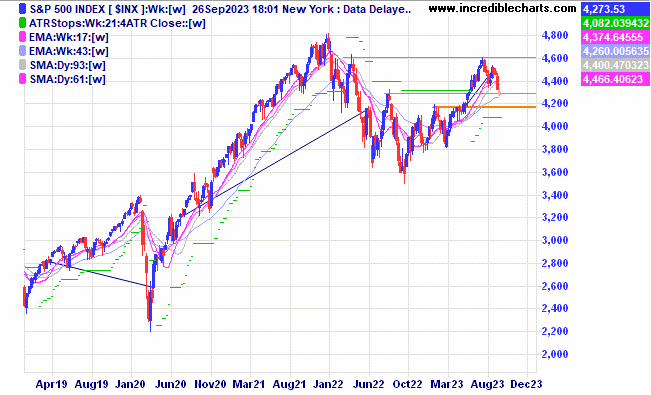
The US S@P 500 broke through the recent lows after making a lower high. Short-term trend looks to be down from here with possible support coming in at around 4,200 points.
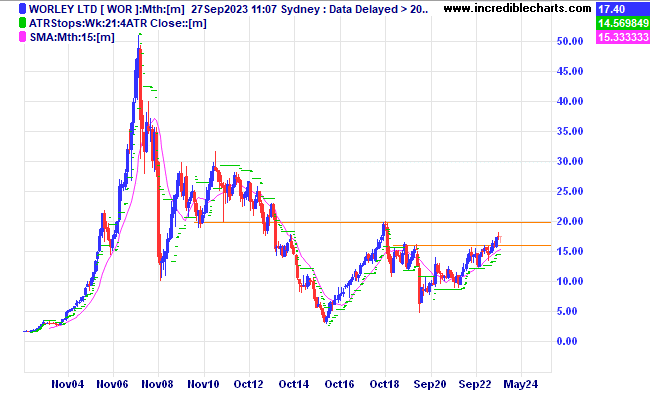
Worley has some serious overhead resistance.
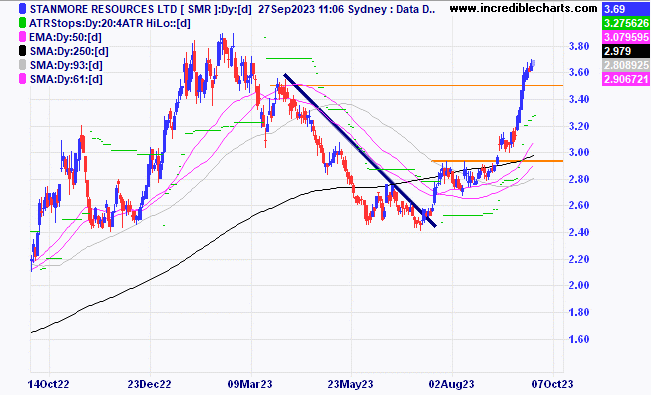
 Stanmore is heading towards the yearly high.
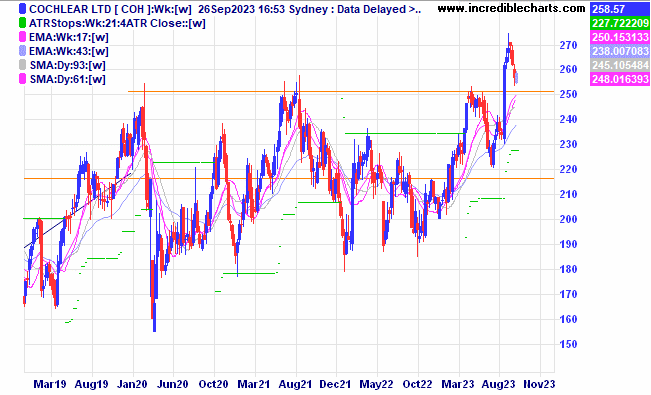
Cochlear looks to be making a normal retracement down to the breakout zone.
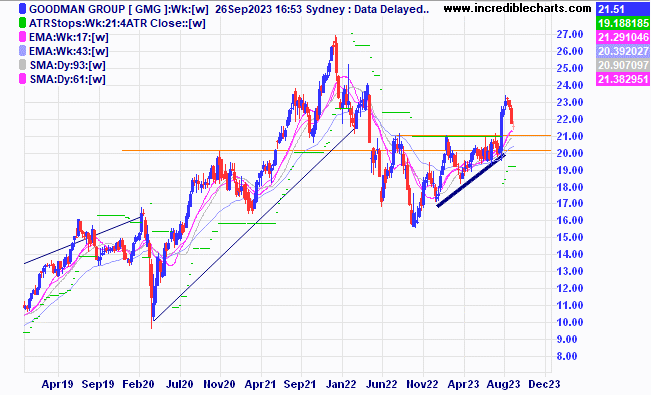
Goodman Group is making a similar retracement down to a support zone.
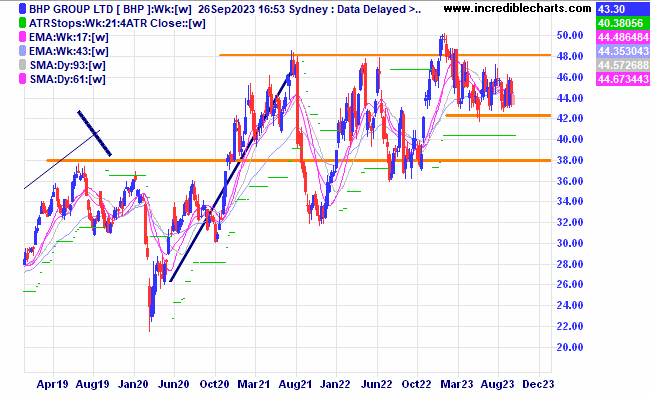
BHP is still stuck in a sideways range.
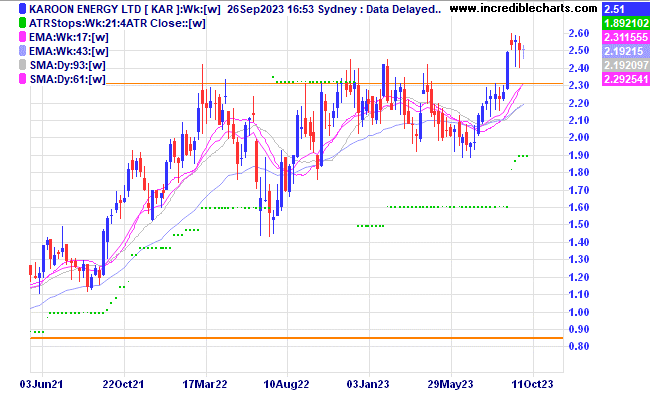
Karoon Energy is holding onto recent gains.
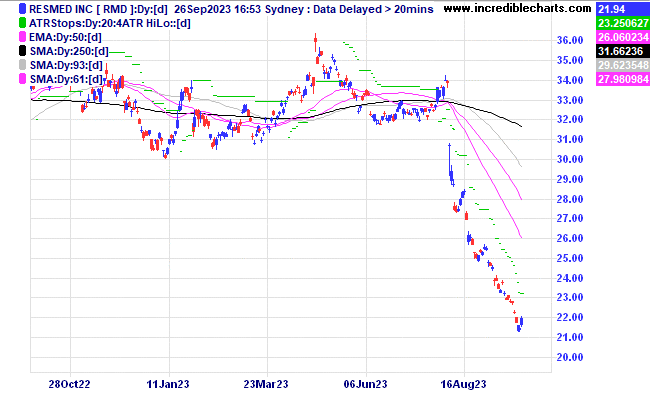
After dropping around 30 per cent ResMed looks to have caught a bid higher for now. Some analysts reckon the selling over the possible impact of popular weight loss drugs is overdone.
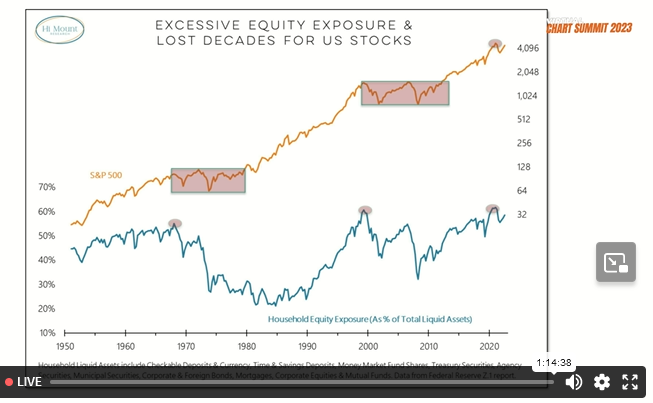
This chart from a recent US based charting webinar shows that when US households lose interest in equities that markets can stagnate for some time. Given the increase in widely held index ETF’s will this stagnation still occur to the same extent?
Disclaimer: The commentary on different charts is for general information purposes only and is not an invitation to trade. Trading is risky and individuals should seek Professional counsel before making any financial decisions. Many thanks to Incredible Charts.com software for most of the charts used in the column.
Monitor, measure, manage and maximise… Cheers Charlie.
To order photos from this page click here


