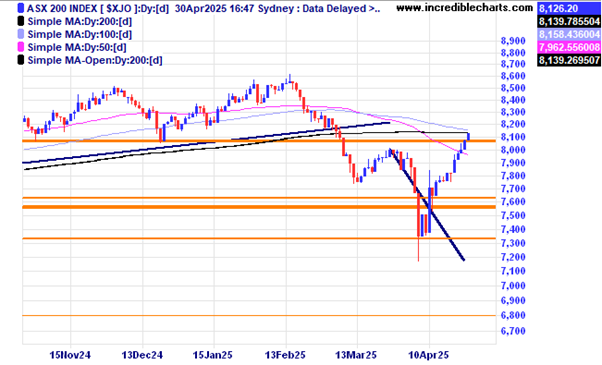
Good morning. The local market ticked up late yesterday (Wednesday 30th) after the latest inflation figures were released with underlying annual inflation coming in at 2.9 per cent and is very close to moving back above the 200 day moving average. A boost from Microsoft and Meta’s latest positive updates could see the local index up nicely today.
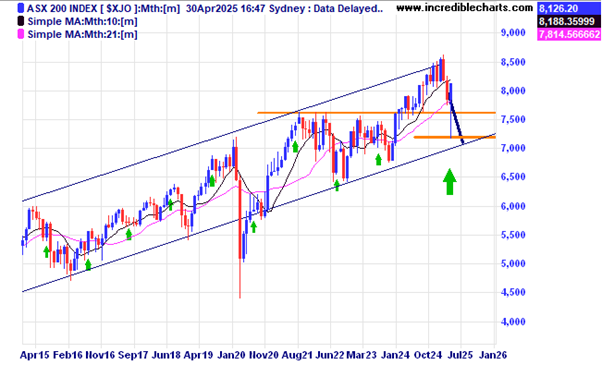
On the monthly chart the local index had it’s 6th best monthly turnaround ever according to some.
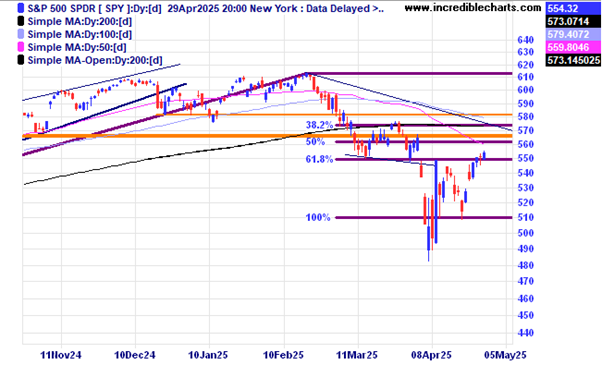
In the US overnight prices were boosted from Microsoft and Meta’s latest bullish updates. The non-farm payroll numbers due out Friday night our time will be another important market driver.
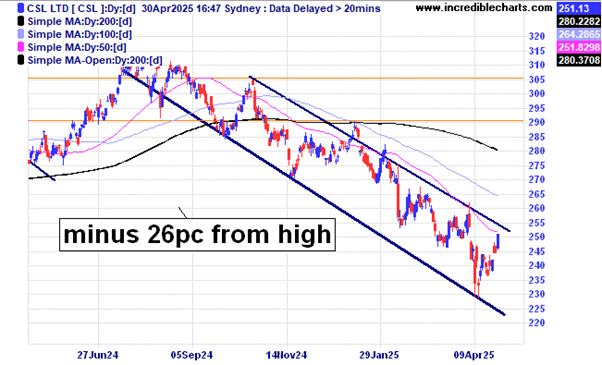
A daily chart of CSL shows price is yet to climb out of the down trend channel.
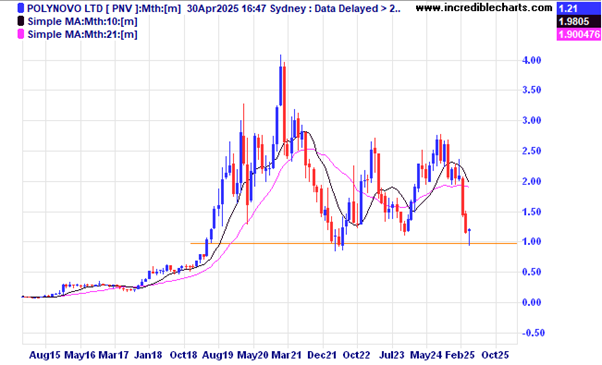
The ever oscillating price of Polynovo has again bounced off the one dollar level.
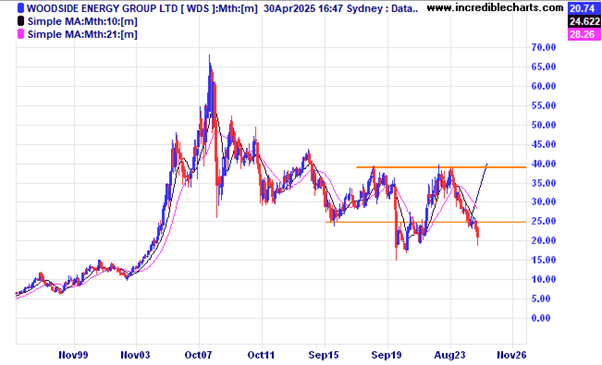
Woodside Energy is testing the lows.
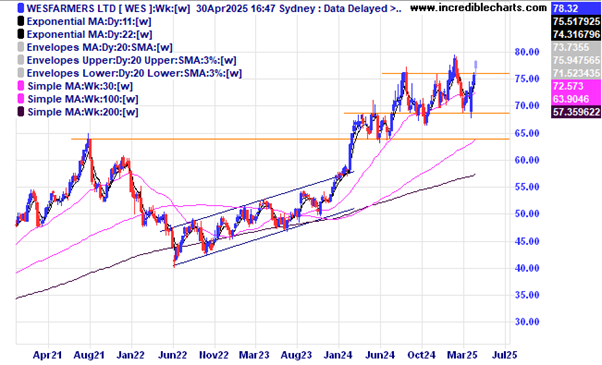
Wesfarmers looks to be faring better than most.
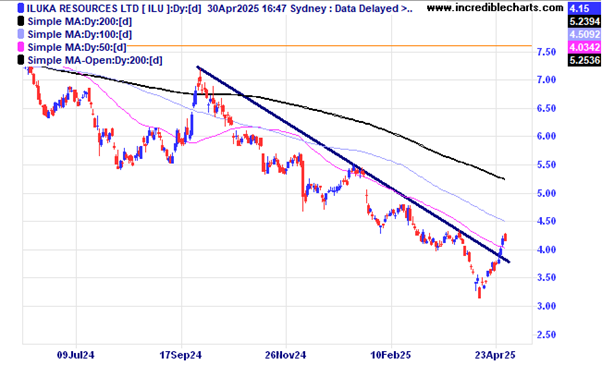
Iluka has moved above the down trend line. Making a higher low would be another sign of strength.
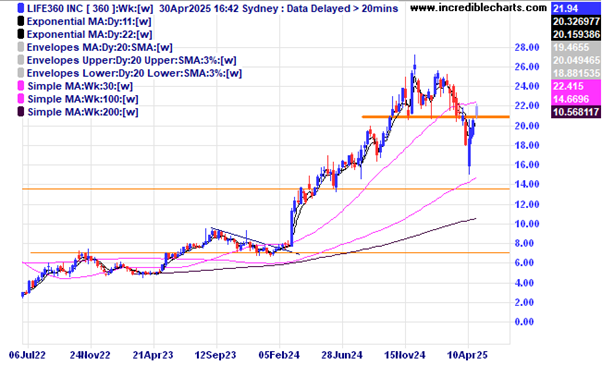
Life 360 has moved above the support/resistance zone for now.
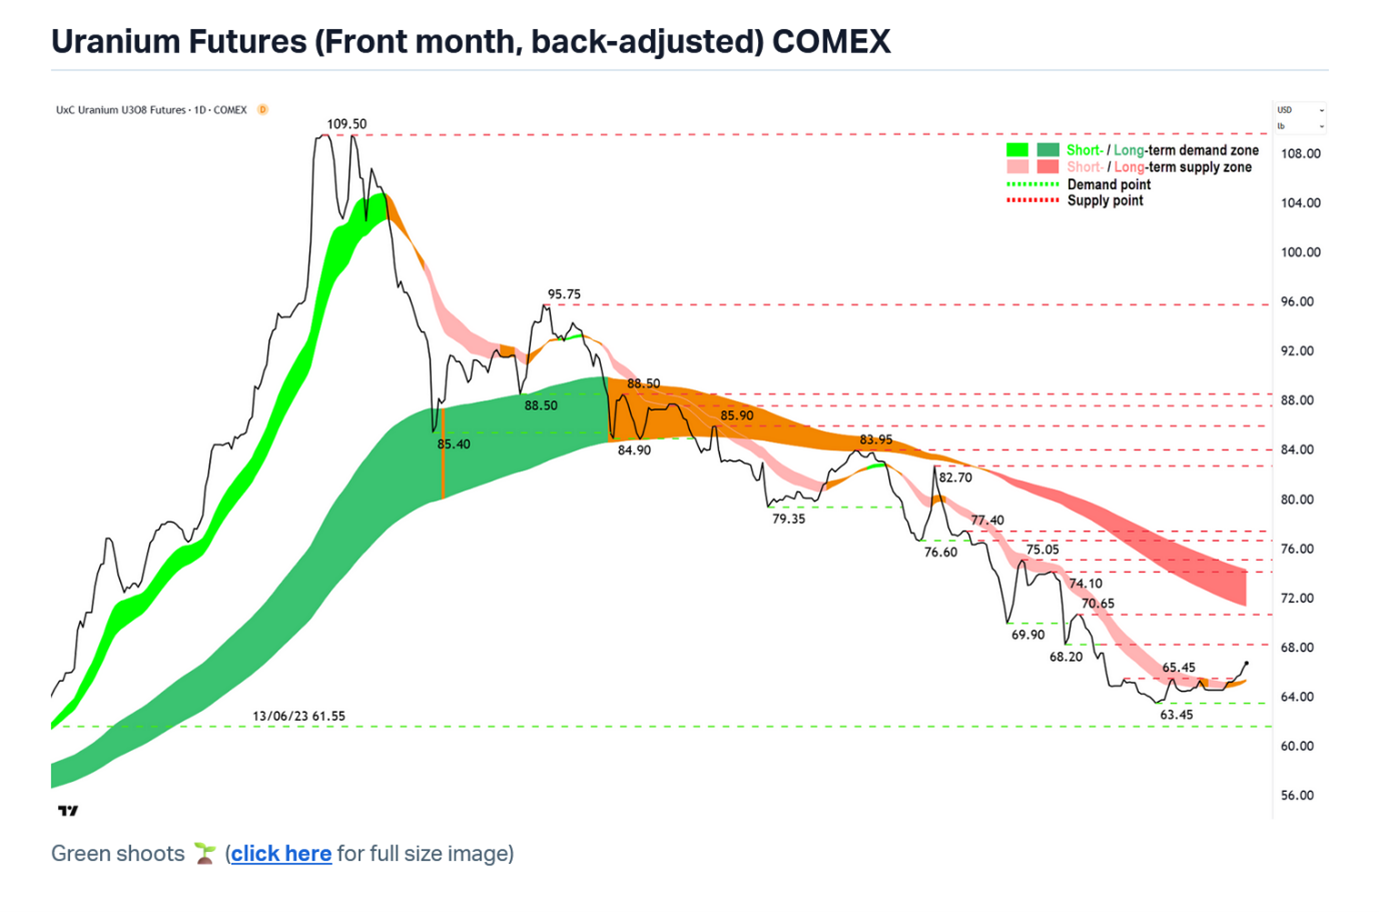
This chart from Carl Capolingua at Market Index shows a slight upturn in the price of uranium. The Market Index site is a treasure trove of information.
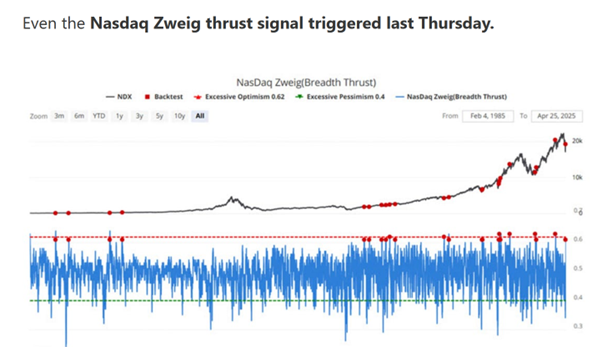
The Nasdaq Breadth Thrust indicator recently triggered and historical figures show it generally signals better prices moving forwards. Correlation is not necessarily causation.
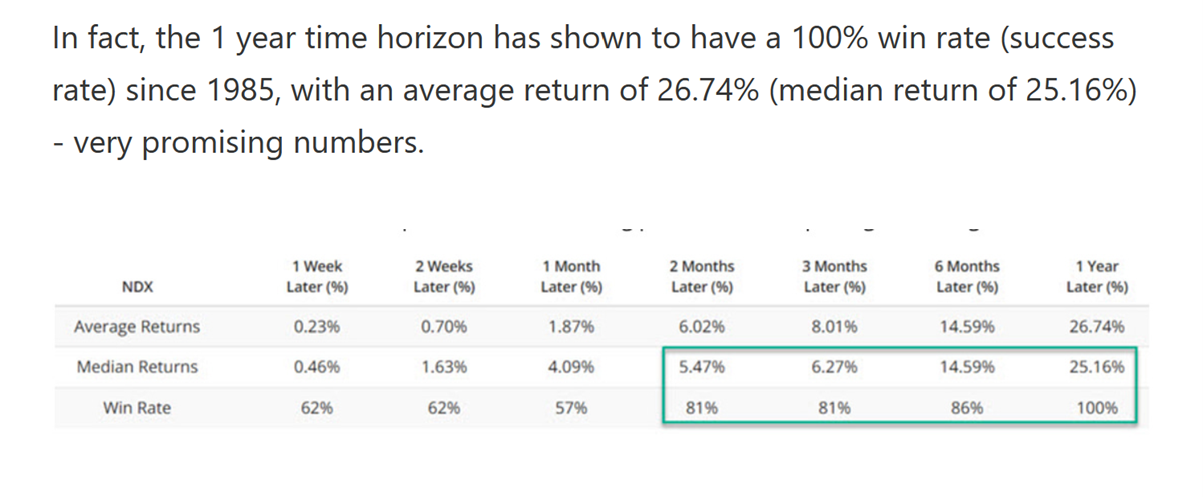
The overall statistics of gains and losses after the Nasdaq Breadth Thrust is triggered.
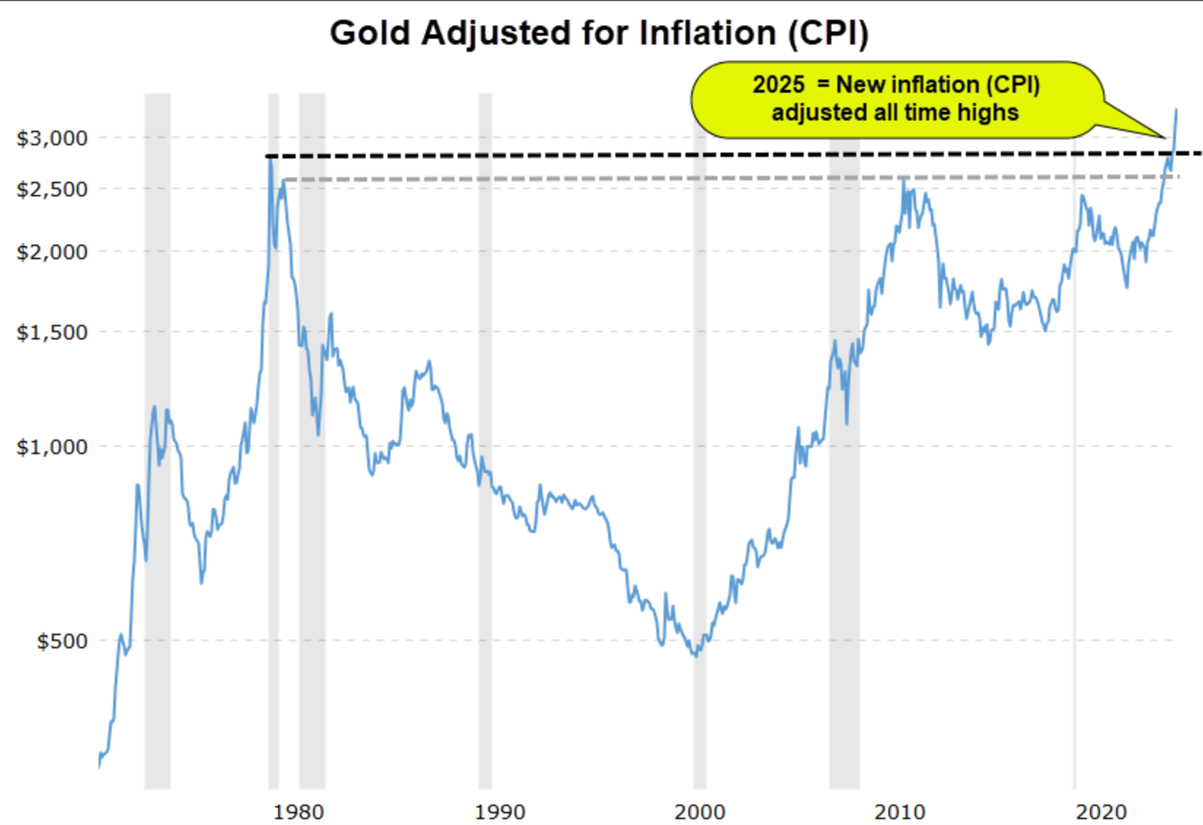
This graph shows the price of gold recently hit an all-time inflation adjusted high.
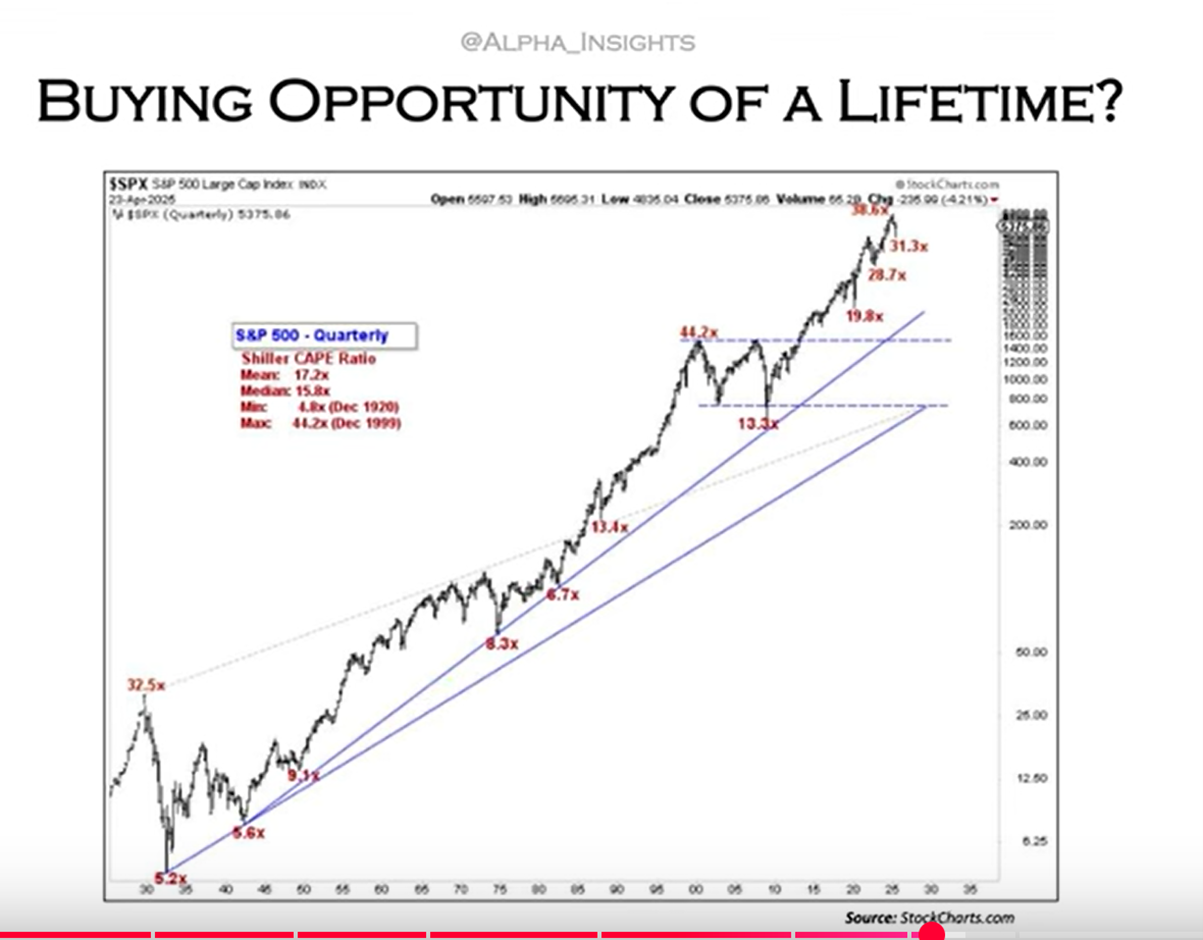
Beware the lurking bear. This quarterly chart of the S@P 500 index is taken from a Youtube video of a David Keller interview with Jeff Huge from Alpha Insights and shows a very bearish view of where we might be going next…down, down, down….towards the midline of this chart and a Shiller CAPE Ratio of around 13 times, a long way from the 30 times measure now. With President Trump’s globally disruptive tack anything is possible. For most analysts staying above the 200 day moving average of the index would be one key ingredient to staying out of trouble. The index is yet to move back above that average.
Disclaimer: The commentary on different charts is for general information purposes only and is not an invitation to trade. Trading is risky and individuals should seek Professional counsel before making any financial decisions. Many thanks to Incredible Charts.com software for most of the charts used in the column. Cheers Charlie.
To order photos from this page click here


