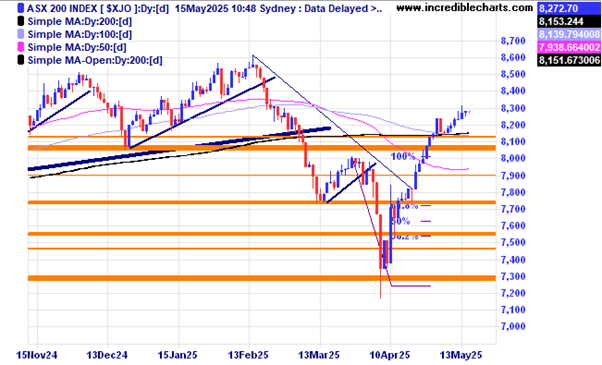
The local index shows the daily range consolidating at these levels. After a fast move up from the lows a bit of a pullback would be normal.
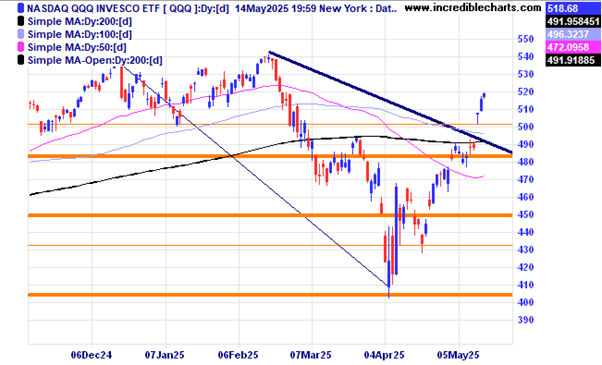
US Stock markets gapped up on the news that the US and China would have a pause on tariffs for 90 days. The QQQ ETF has retraced around 75 per cent of the recent losses.
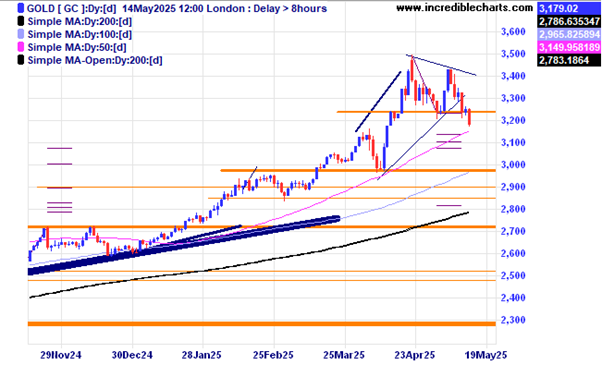
The gold price fell on news of a truce on tariffs between the US and China and has also fallen below an area of support. Next major support comes in near the US$3,000 an ounce mark.
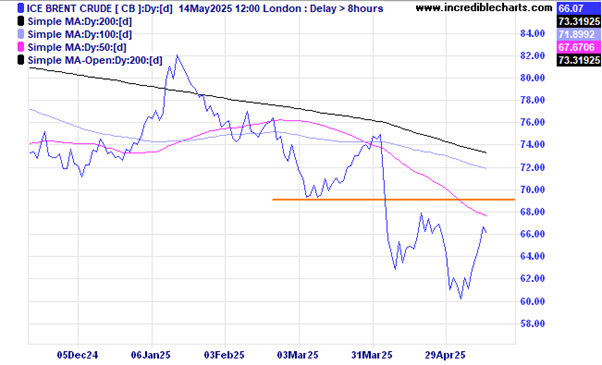
The Brent Crude Oil price is up from the lows and could run into some overhead resistance soon.
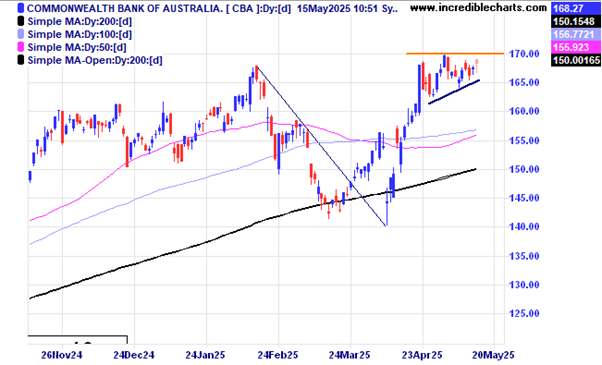
The Commonwealth Bank recently reported a six per cent jump in quarterly profits compared to this time last year. The price looks to be consolidating at these levels before the next move.
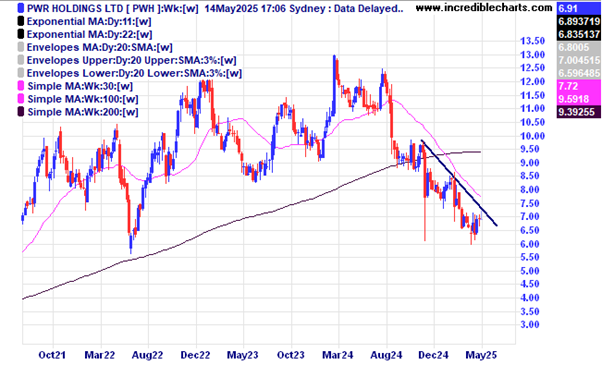
PWR Holdings has yet to break the down trend line.
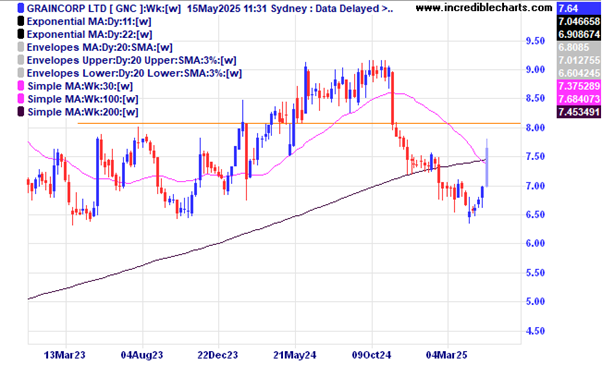
Investors were happy with Graincorp’s latest update pushing prices up around 7.5 per cent today.
This chart of BHP shows the spike down and recovery in prices.

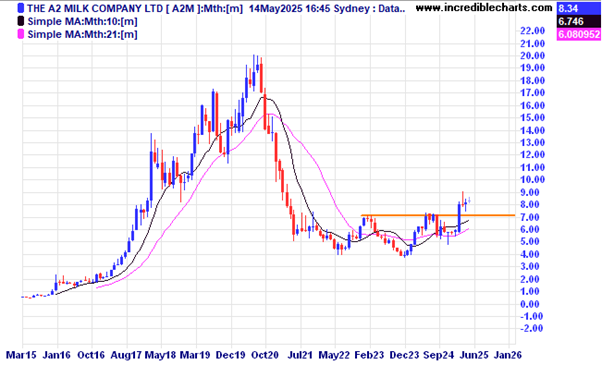
The A2 Milk Company is treading water for now after moving above the resistance zone.
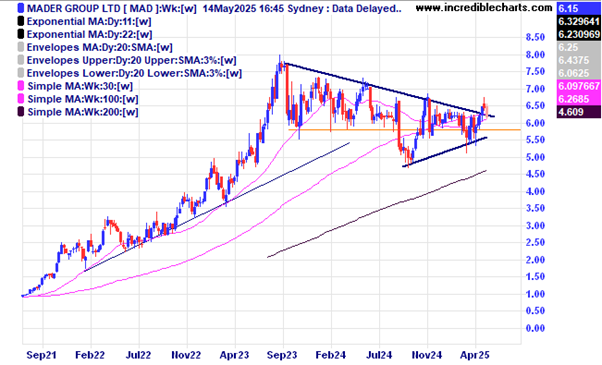
Mader Group looks close to breaking the trend of lower highs.
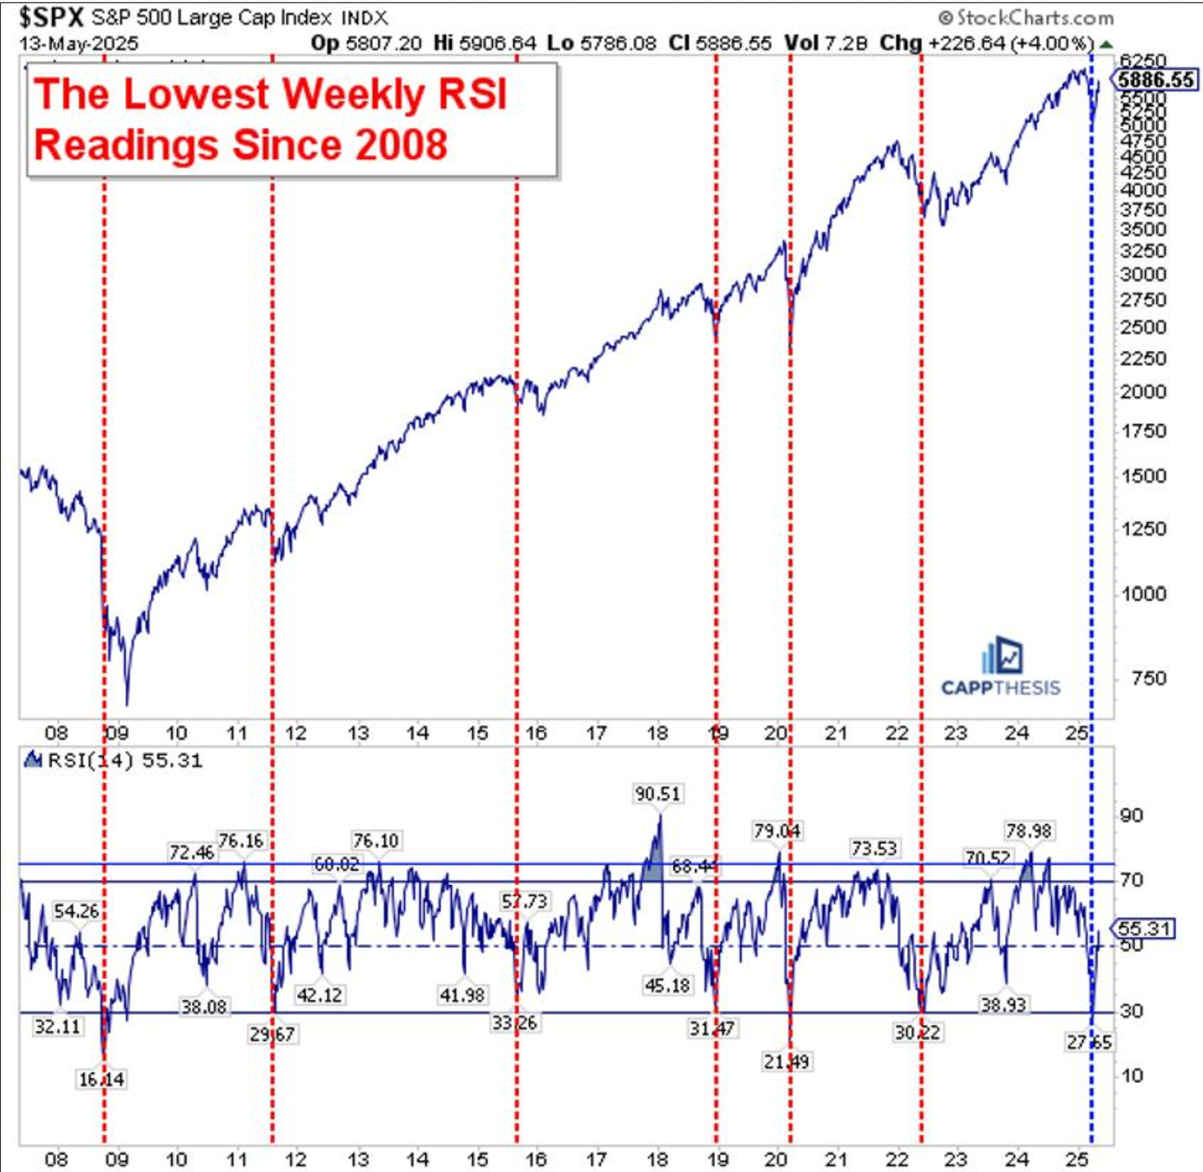
This chart on the Stock charts website from CappThesis shows extremely oversold conditions can turn into a full blown bull market continuation or an initial sharp move up followed by another leg down. Which way will it go this time?
Russell Clarke from Brumby Capital has highlighted this chart from Bloomberg showing that the yield of Japanese Bonds has moved above the estimated yield of the US S@P 500 index. The previous two times this happened were back in the 1990’s before the dot.com bust and before the GFC in 2008. Correlation is not necessarily causation but certainly gives us something to think about.

Disclaimer: The commentary on different charts is for general information purposes only and is not an invitation to trade. Trading is risky and individuals should seek Professional counsel before making any financial decisions. Many thanks to Incredible Charts.com software for most of the charts used in the column. Cheers Charlie.
To order photos from this page click here


