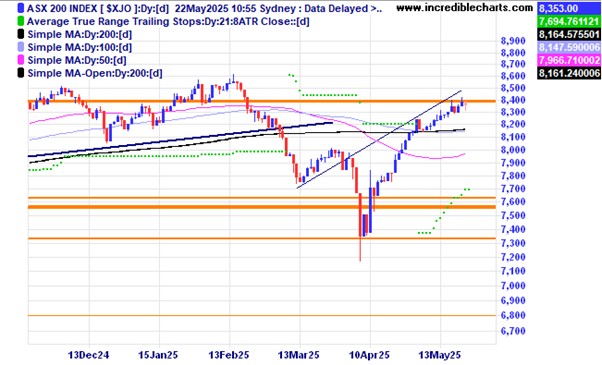
The local market looks to be stalling at these levels.
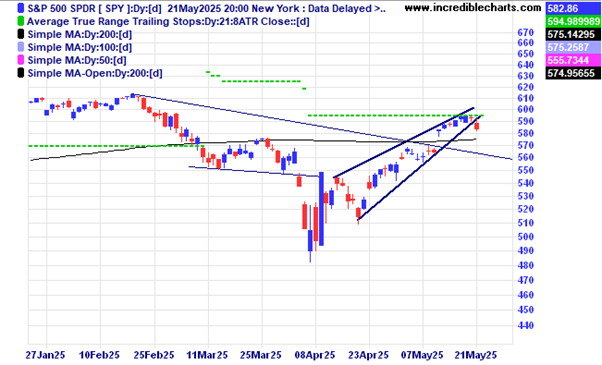
The SPY ETF of US stocks has moved below the up-trend line and out of a bearish rising wedge pattern last night after a poor US T bond auction result say analysts.
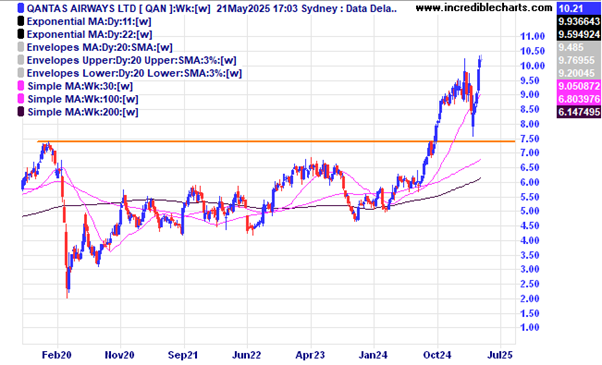
Qantas is close to all-time highs.
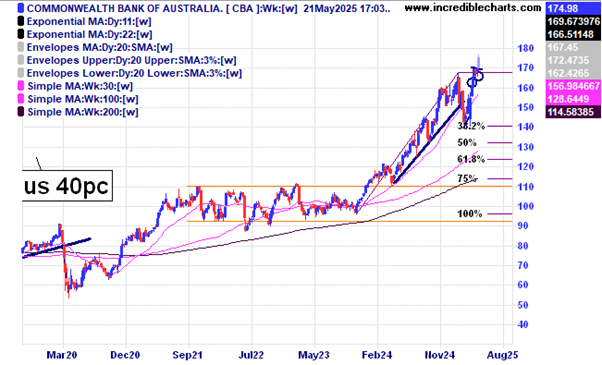
The Commonwealth Bank is still rising, how far go it go before gravity takes hold?
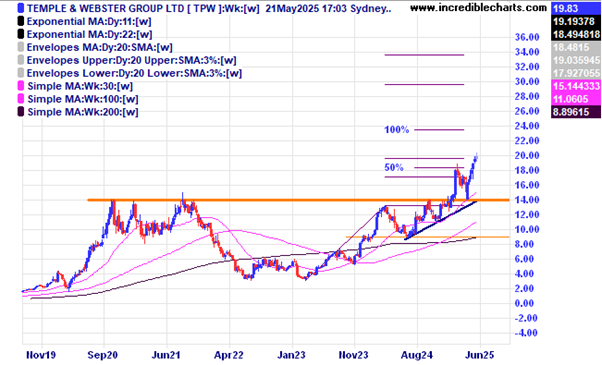
Temple and Webster had a nice bounce off the support and resistance zone.
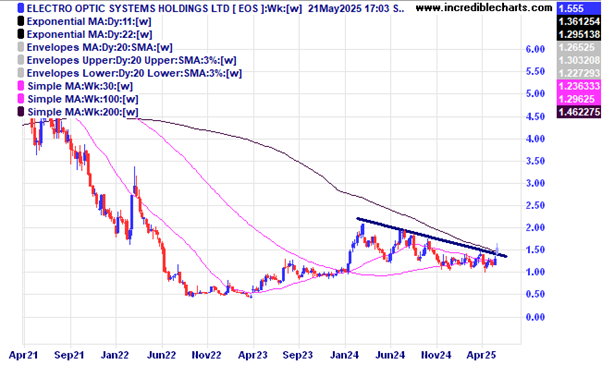
Electro Optic Systems has moved above the down trend line.
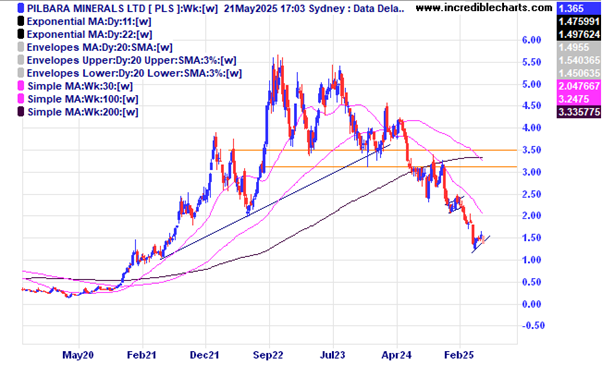
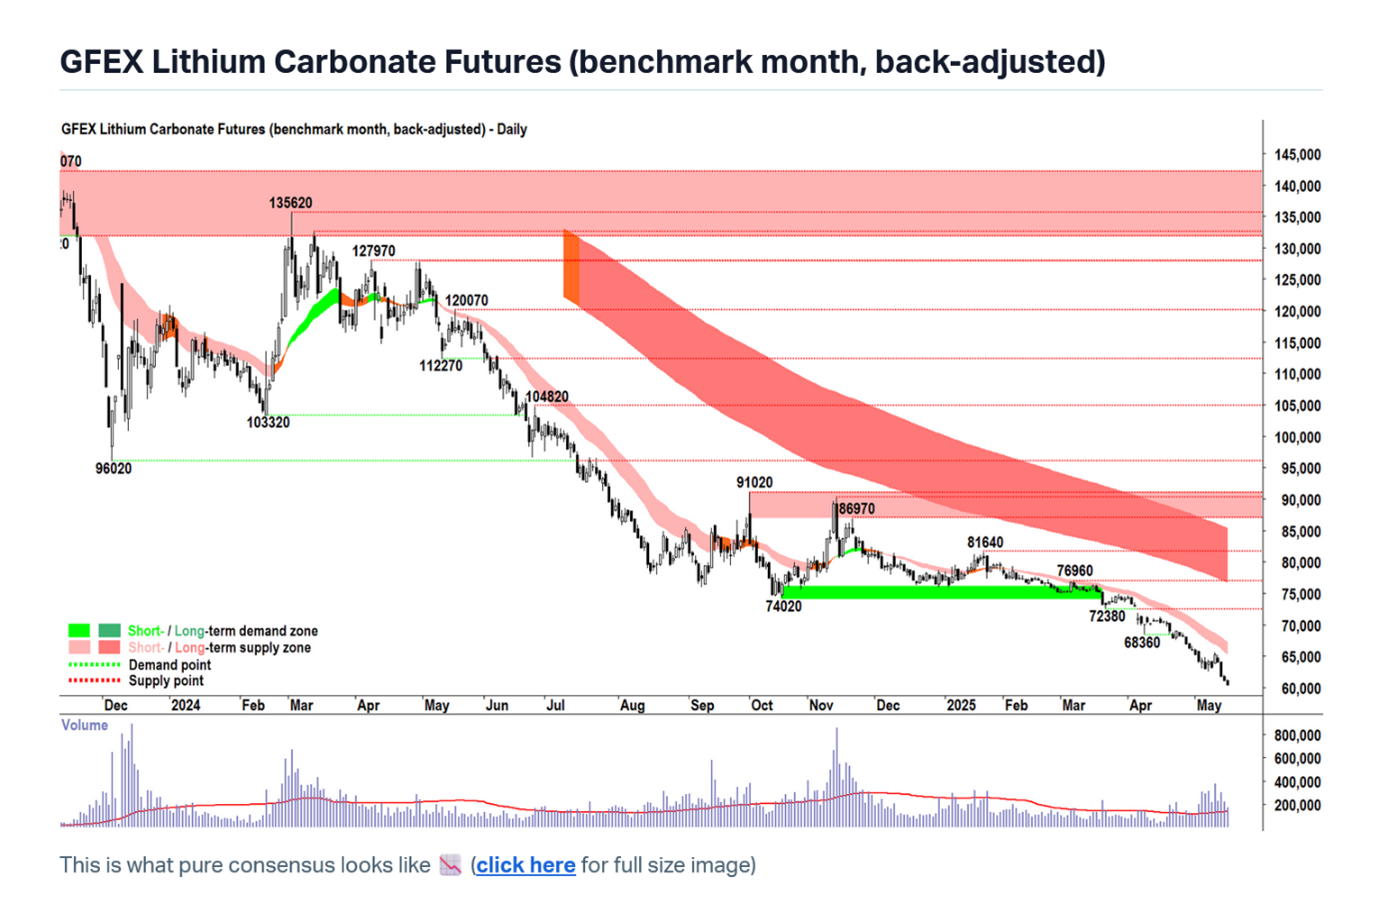
With the lithium price near four-year lows Pilbara Minerals looks vulnerable if the bearish flag pattern has some follow through.
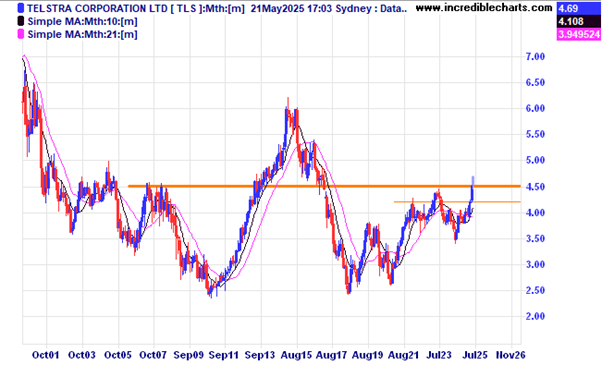
The price of Telstra has moved above a previous resistance zone.
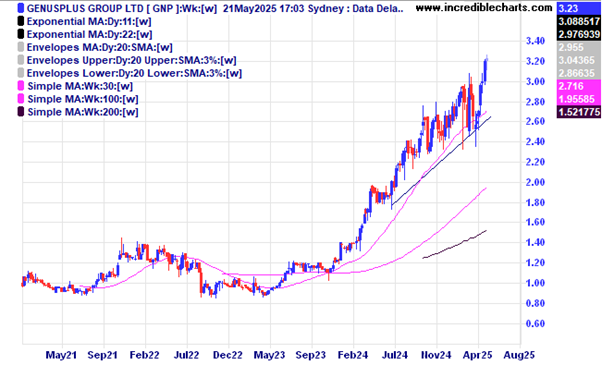
The Genusplus trend continues.
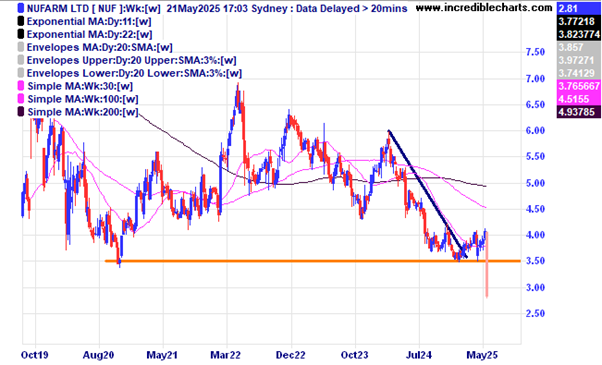
Nufarm shares tanked after their latest update.
This chart of lithium prices comes from the Market Index website.
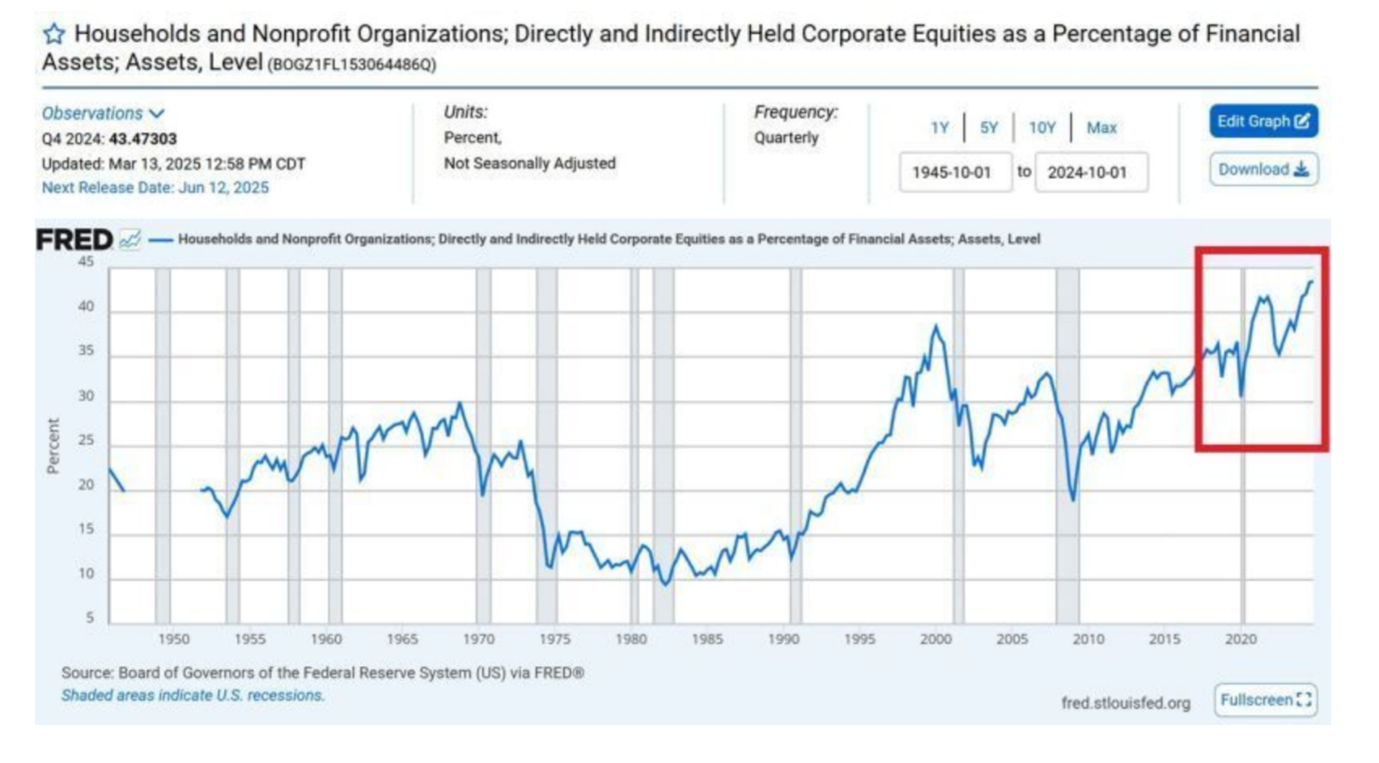
This graph shows household and non-profit organisations in the US level of holdings in corporate equities as a percentage of financial assets was at a record high back in March.
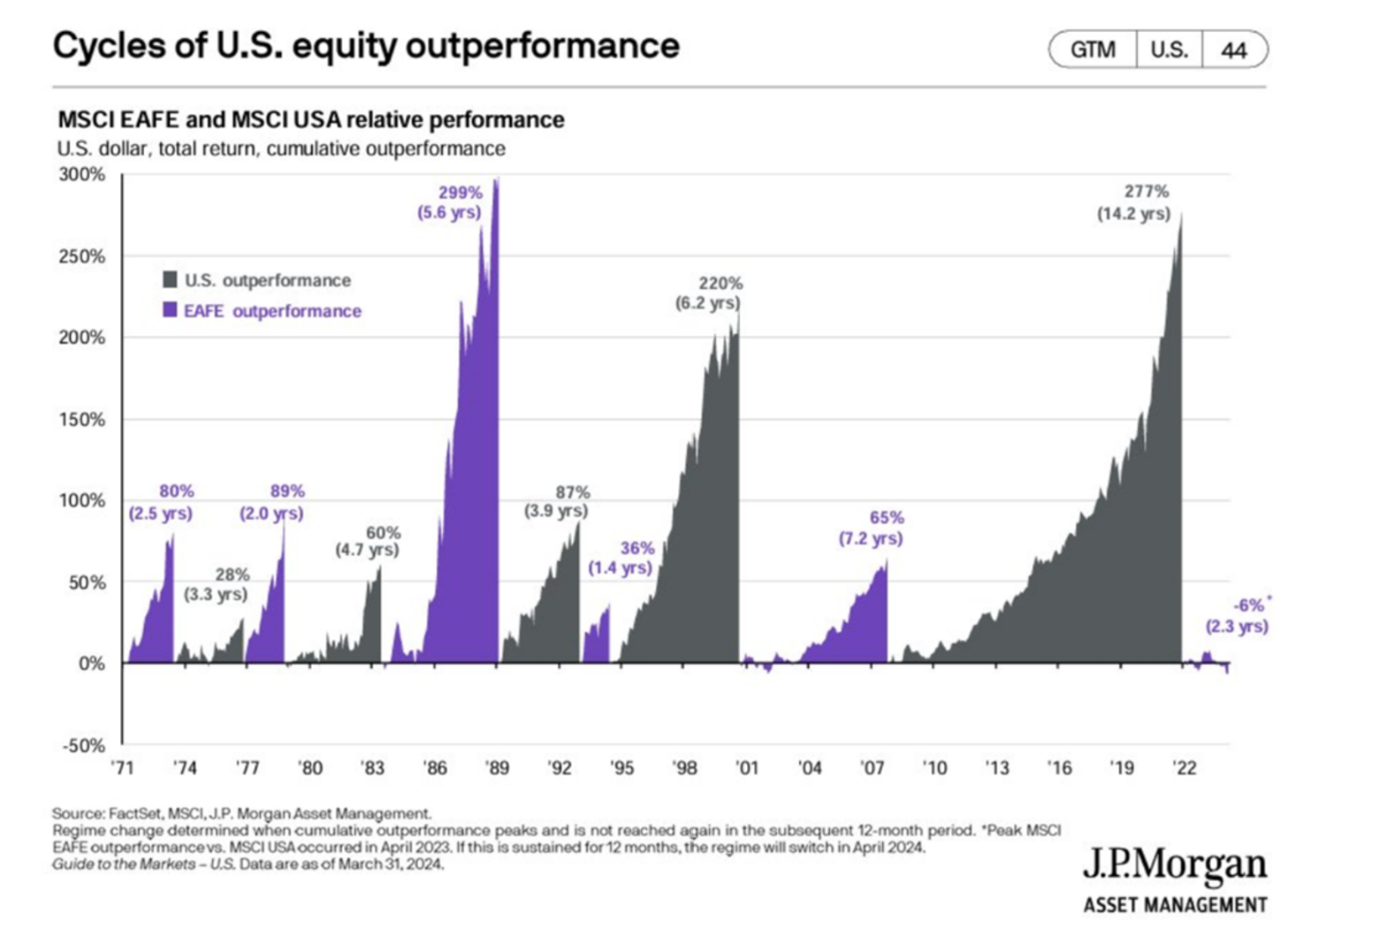
A very informative graph from the latest edition of Firstlinks showing the cycles of US equity out performance and under performance compared to the EAFE index. The tide could be turning.
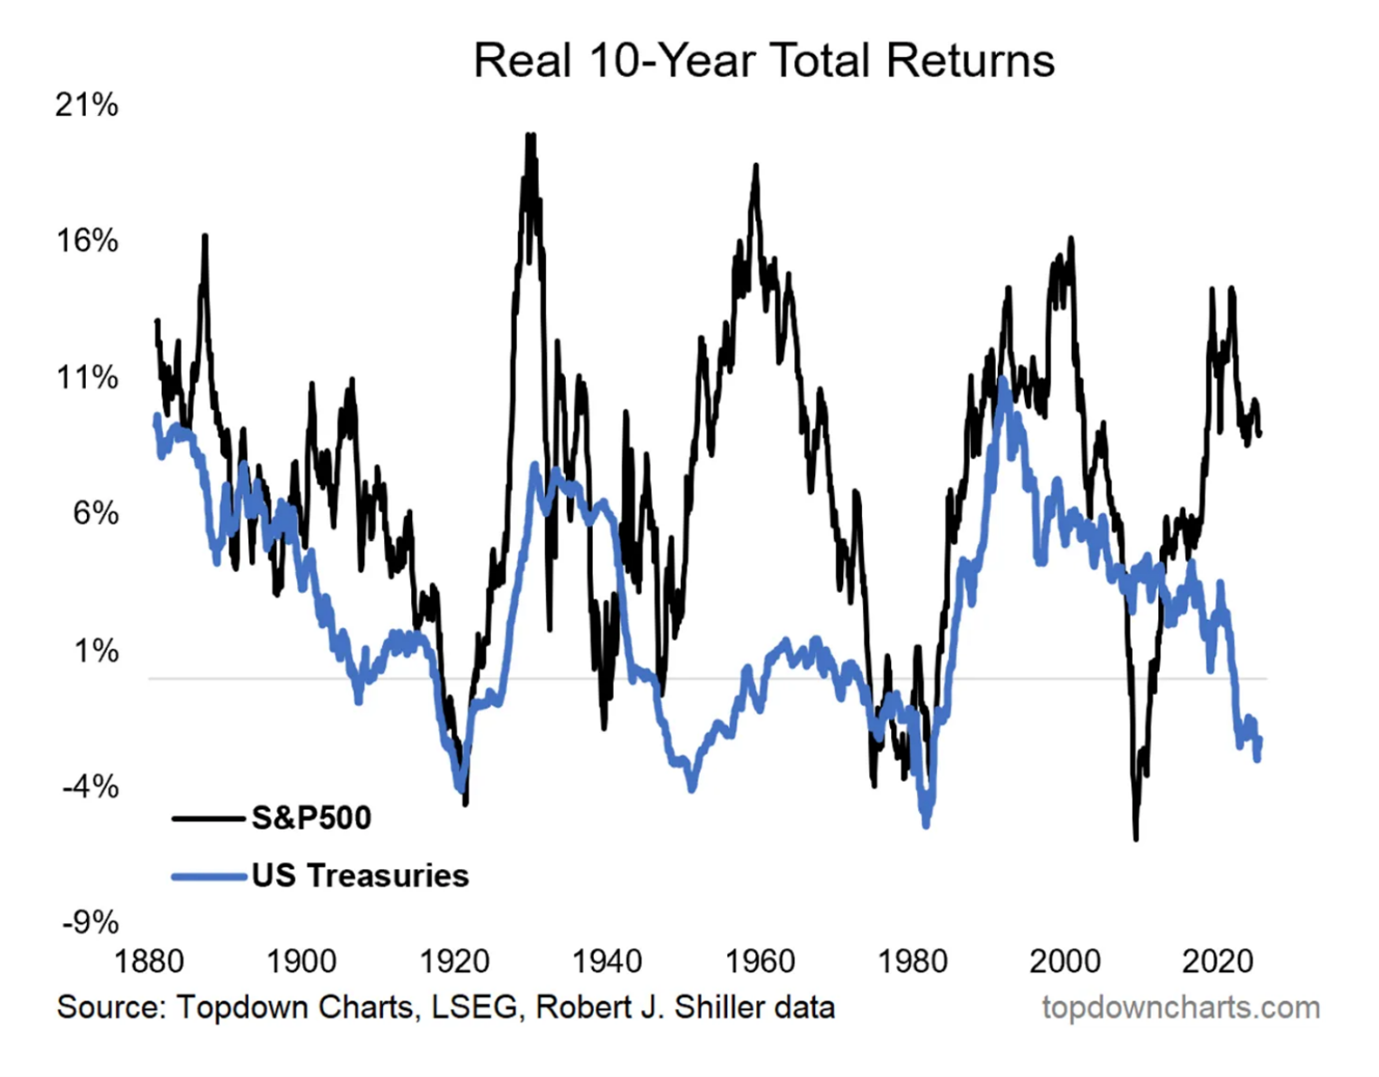
This chart shows the relative relationship between the “expensive” shares and the “cheap” bonds. This could be something to ponder before any change in asset allocation.
Disclaimer: The commentary on different charts is for general information purposes only and is not an invitation to trade. Trading is risky and individuals should seek Professional counsel before making any financial decisions. Many thanks to Incredible Charts.com software for most of the charts used in the column. Cheers Charlie.
To order photos from this page click here


