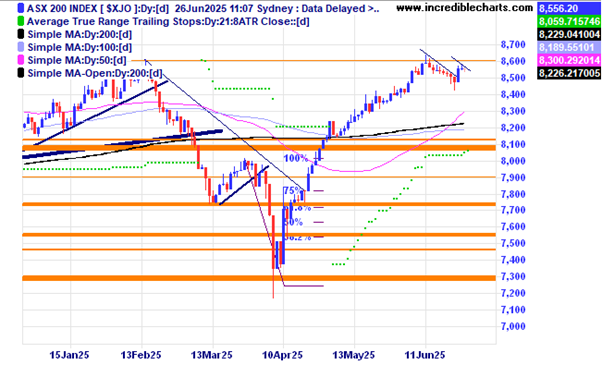
The local market looks to be treading water for the moment. With the Trump Tariff deadline approaching and tensions in the Middle East anything could happen.
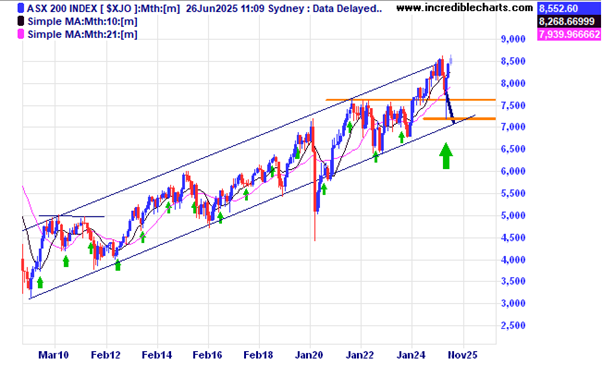
The local index on the monthly chart shows price near the upper boundary of the trend channel.
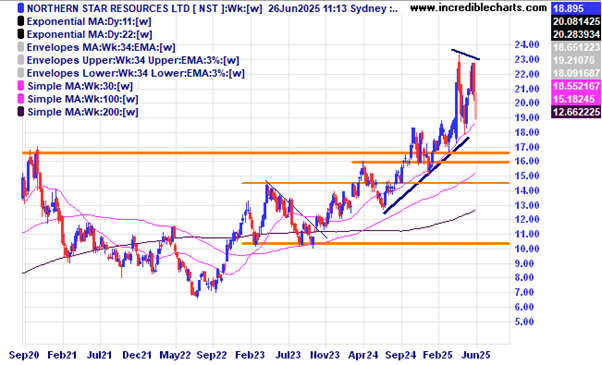
The price of some local gold miners has been more volatile than the price of gold.
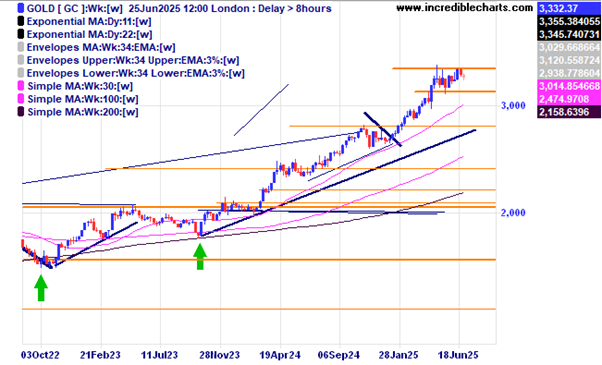
The price of gold has been trading sideways for a while now, perhaps consolidating the big move up.
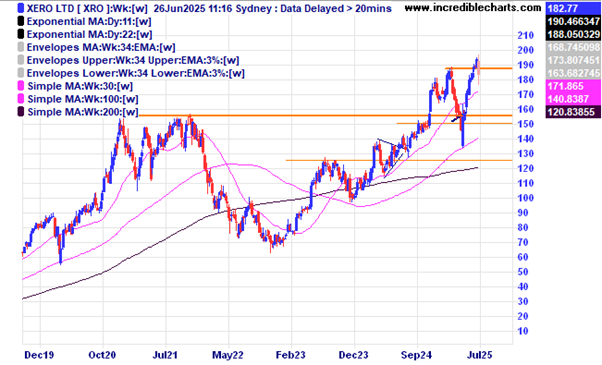
Xero has just announced a large US acquisition.
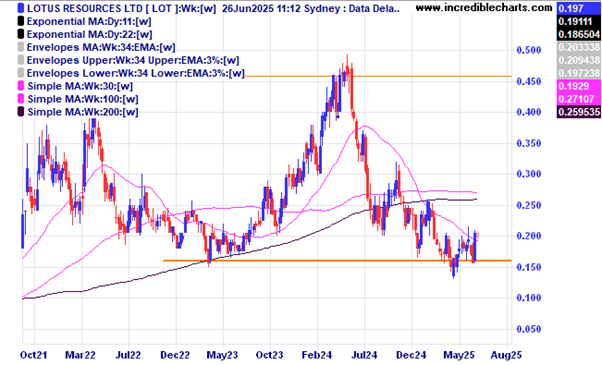
Lotus Resources looks like it could be forming a basing pattern here after making a slightly higher low.
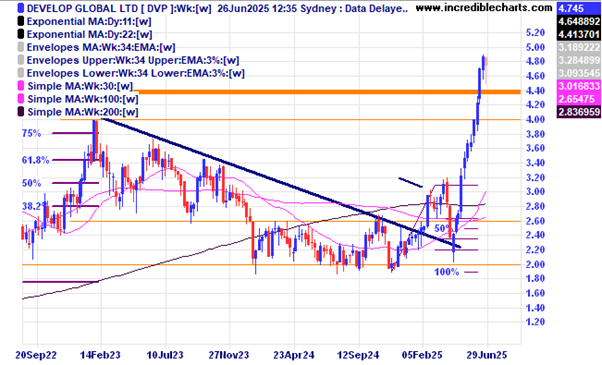
Develop Global’s share price is holding up well after a fresh capital raising to help increase future production.
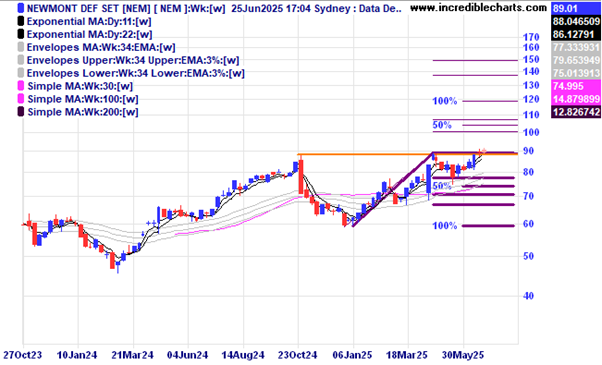
Gold miner Newmont looks to be on the verge of making a fresh high.
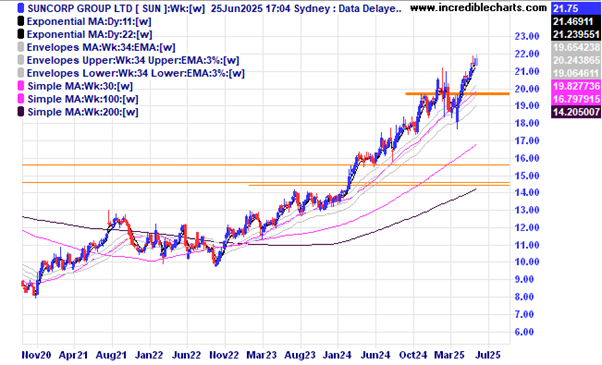
Suncorp has made steady gains over the past three years.
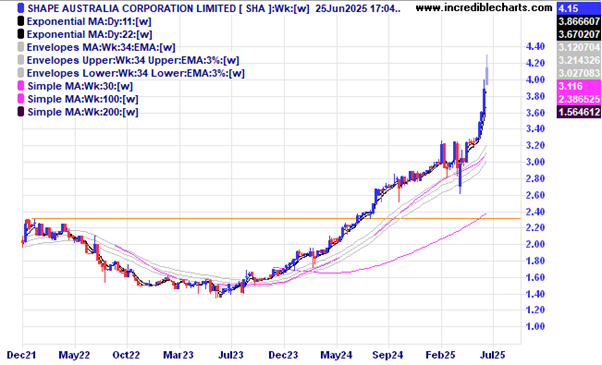
Shape Australia has been on a nice run up since moving above the resistance zone.
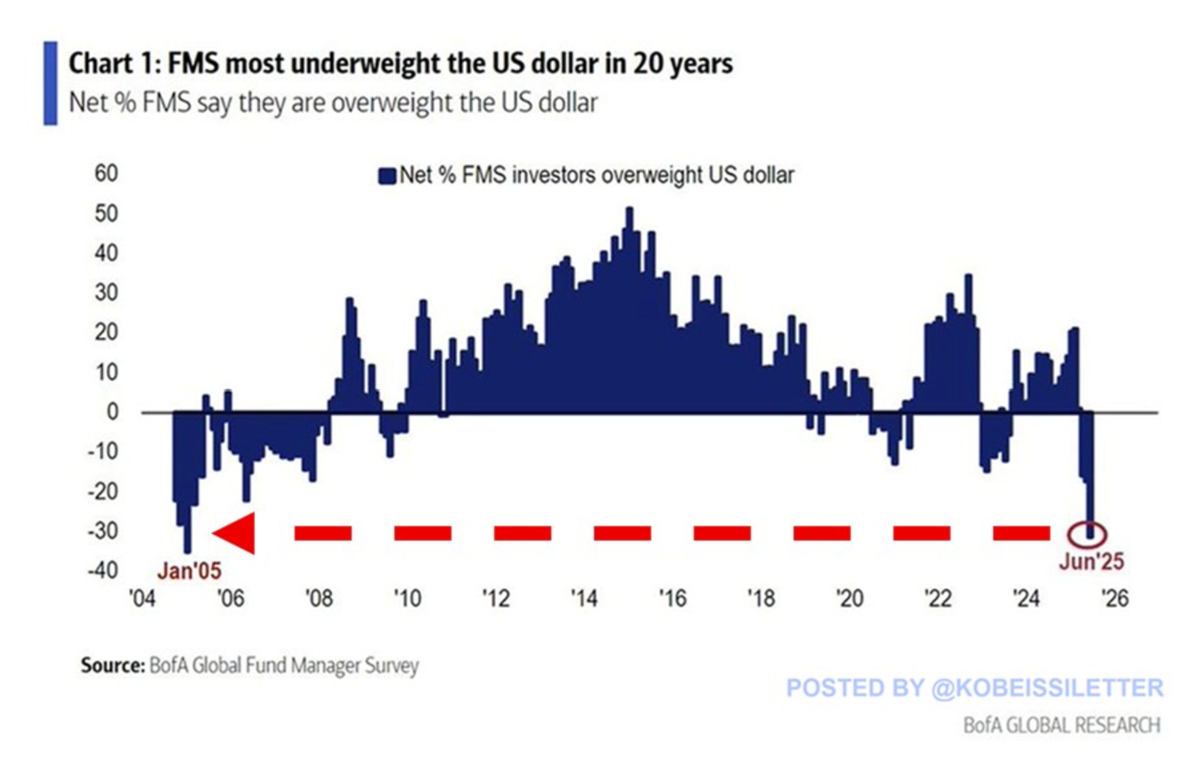
US Fund Managers are very much underweight US dollars.
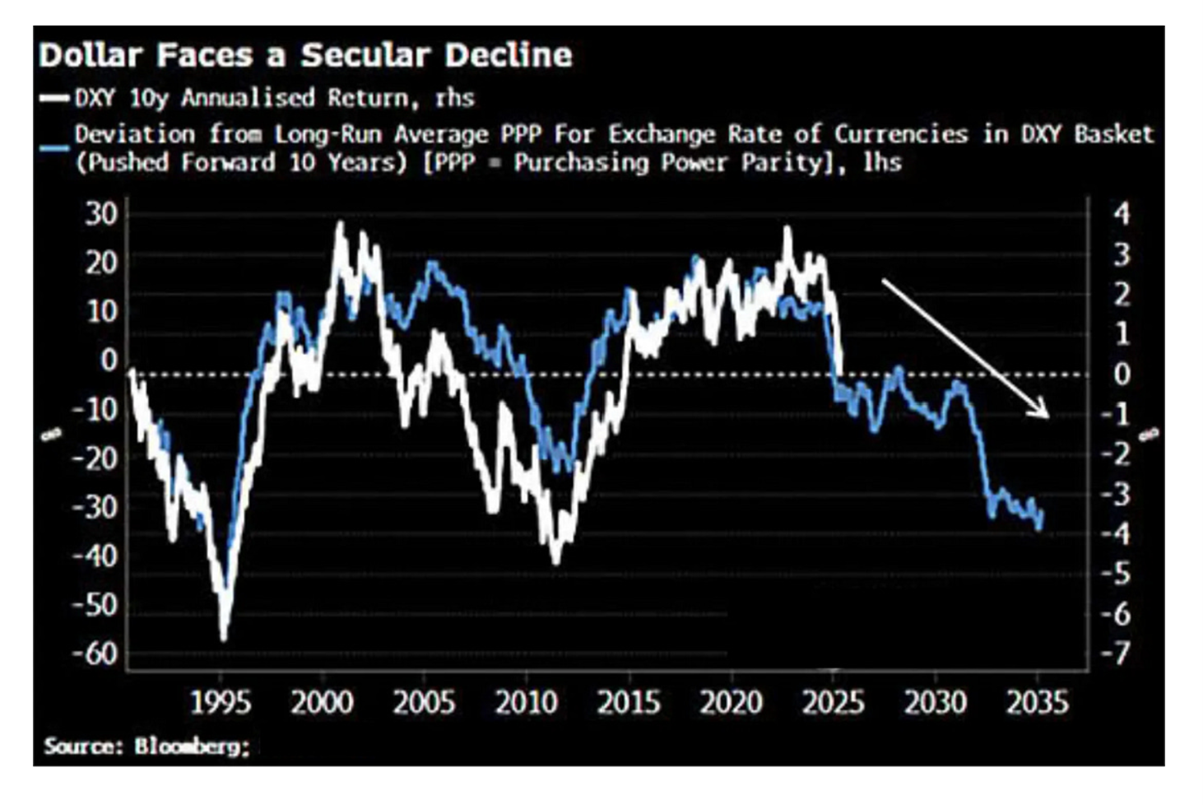
This chart shows one possible projection of the value of the US dollar.
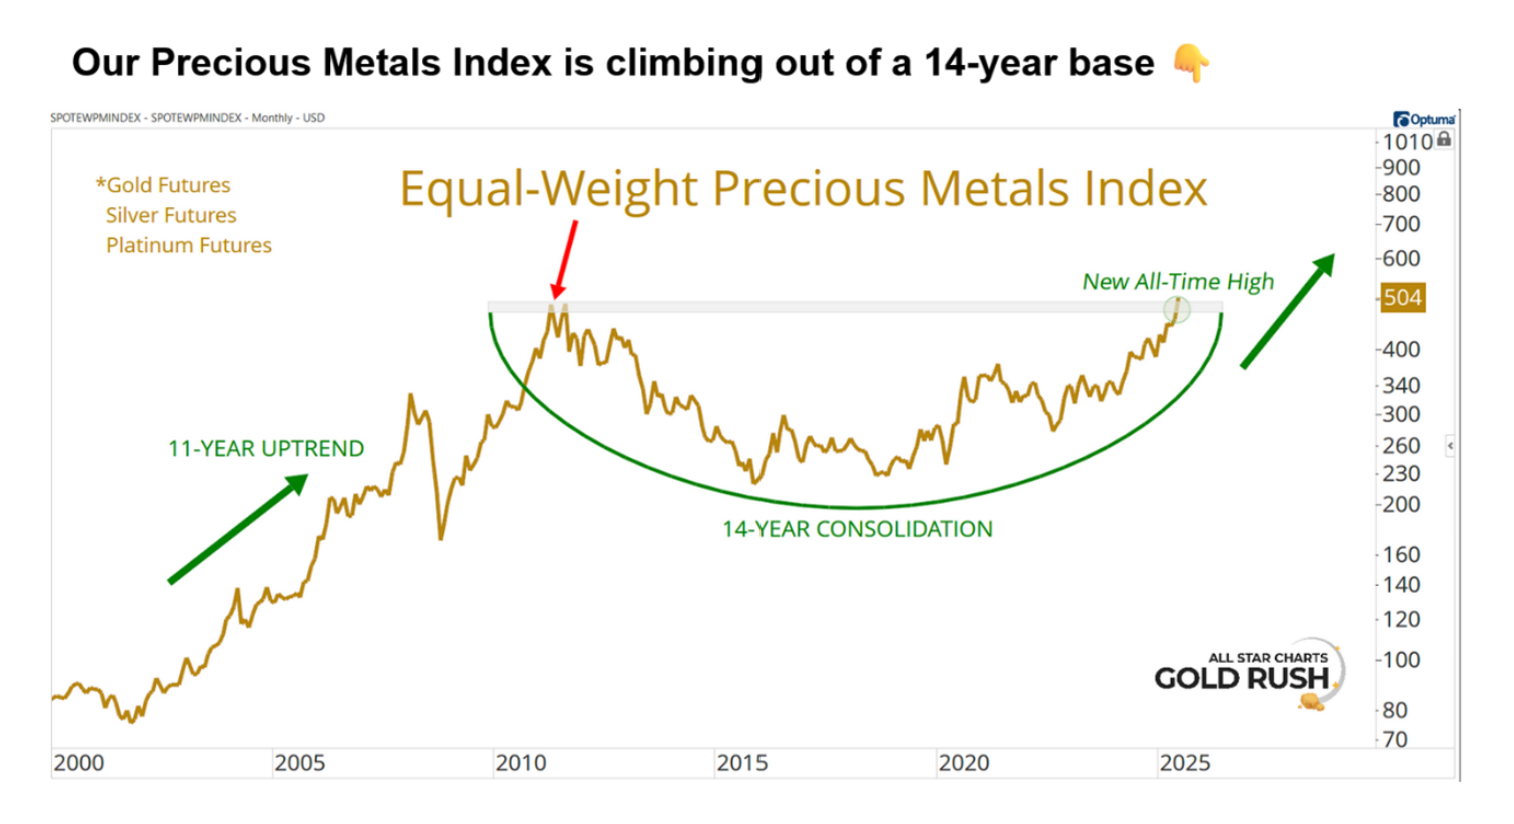
This chart from All Star Charts shows this precious metals index is very close to all-time highs.
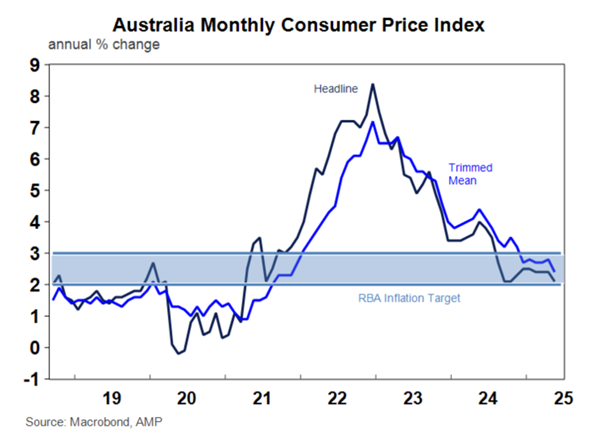
The Australian Consumer Price Index has been moving lower for some time and could increase the possibility of the RBA cutting rates at their next meeting.
Disclaimer: The commentary on different charts is for general information purposes only and is not an invitation to trade. Trading is risky and individuals should seek Professional counsel before making any financial decisions. Many thanks to Incredible Charts.com software for most of the charts used in the column. Cheers Charlie.
To order photos from this page click here


