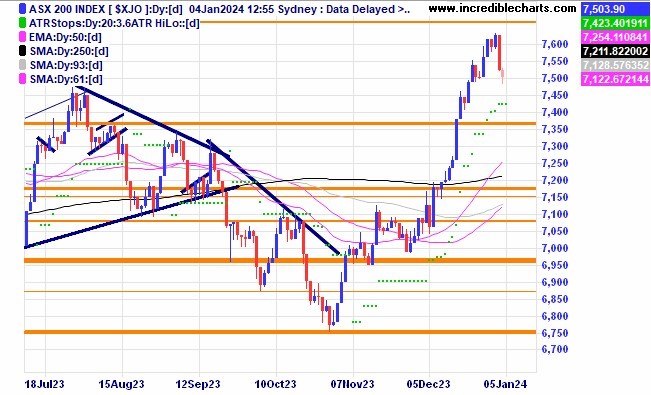
The local market is down for a second day and up from the session lows after a strong run up late last year.
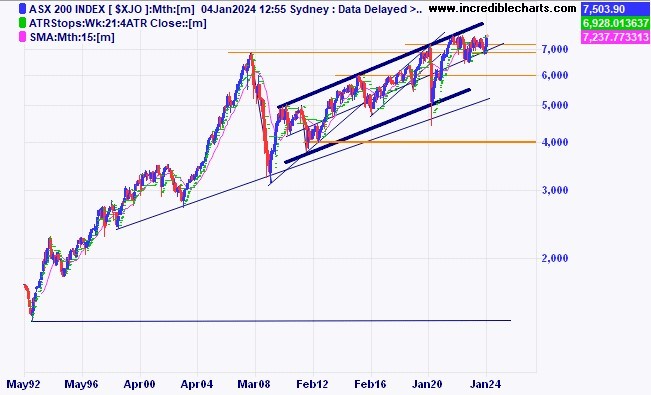
The longer-term chart shows the local market is still in the top half of the rising trend channel.
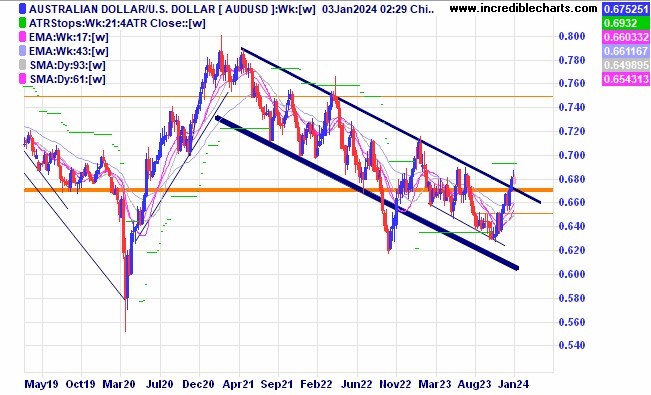
The Australian dollar rose briefly above the down trend channel. Can it stay there going forward?
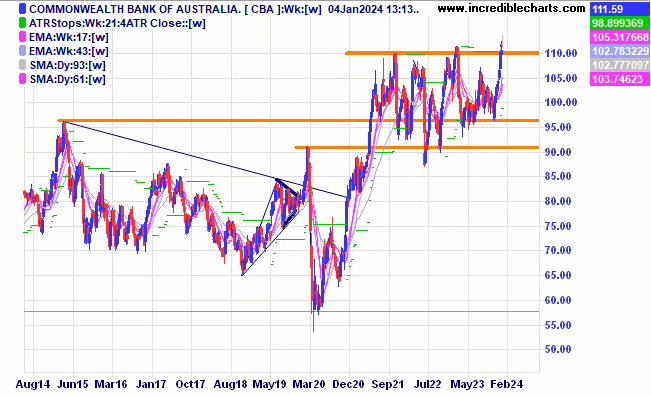
A lot of the big names in the Australian market including the Commonwealth Bank have moved to new highs.
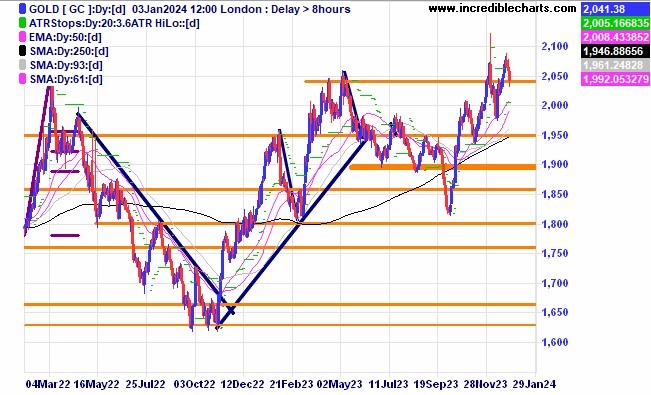
If the price of gold finds support at these levels it could provide a platform for another move upwards.
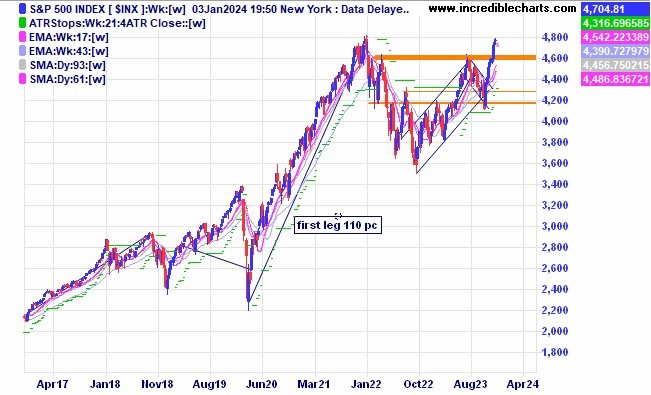
The US based S@P 500 is taking a breather from the recent run up. Will price respect the support zone and provide the base for another leg up?
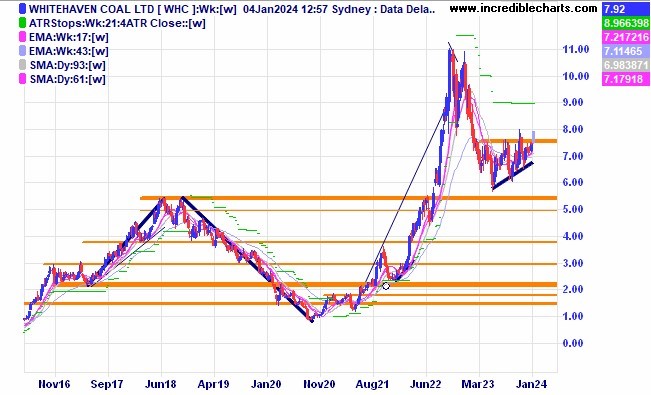
Whitehaven Coal looks to be moving out of the consolidation pattern.
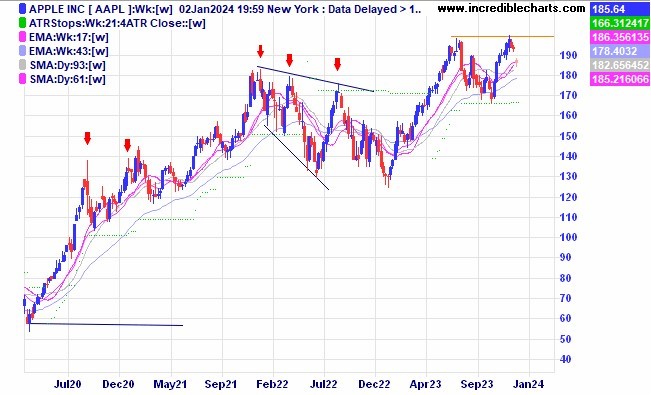
It looks like the price of Apple shares has hit some strong resistance.
The US market can rally for the next 12 months after the last rate hike although it is not a certainty.
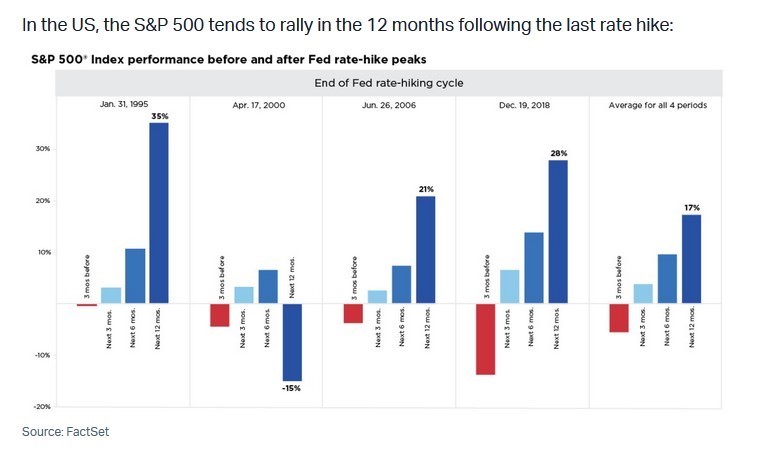
According to this graphic and the market averages the current bullish run could have some way to go before it’s eventual demise.
Disclaimer: The commentary on different charts is for general information purposes only and is not an invitation to trade. Trading is risky and individuals should seek Professional counsel before making any financial decisions. Many thanks to Incredible Charts.com software for most of the charts used in the column. Merry Christmas and a Happy, Safe and Prosperous festive season to all.
Monitor, measure, manage and maximise… Cheers Charlie.
To order photos from this page click here


