What a difference a week makes. Last week’s column began “The local market exploded up yesterday”. This week the big downward moves in different markets around the globe has been all over the news.
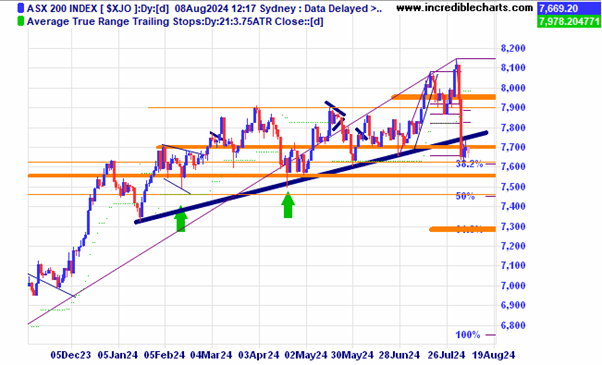
The local market closed below the up-trend line on a daily chart.
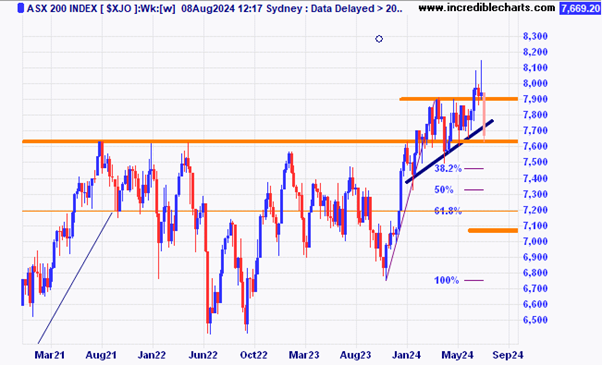
On a weekly chart the down move puts the ASX 200 index back into the sideways chop that began early in the year.
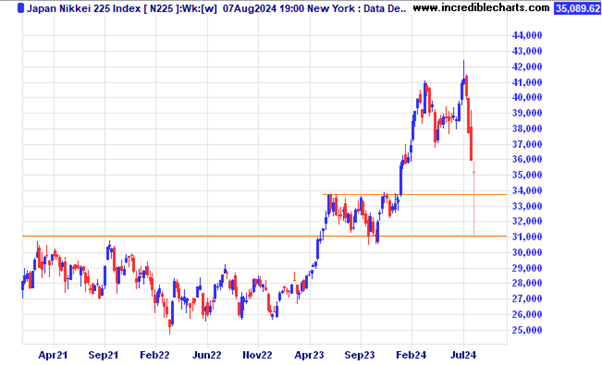
The Japanese stock market was the one that was really clobbered initially falling and spiked lower by around 13 per cent on Monday only to recover most of that loss as the week progressed.
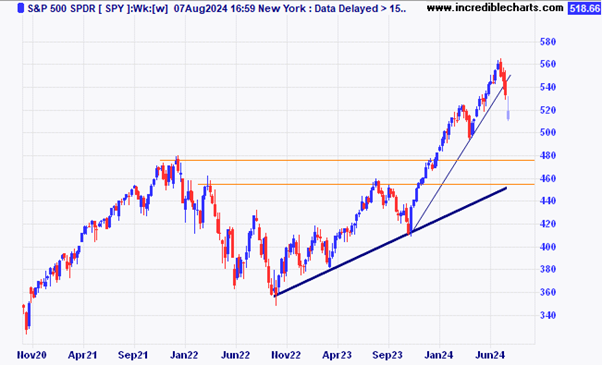
The US based S@P 500 SPY ETF broke below the weekly up-trend line.
The price of gold wobbled a bit and is still above the previous swing low for now.
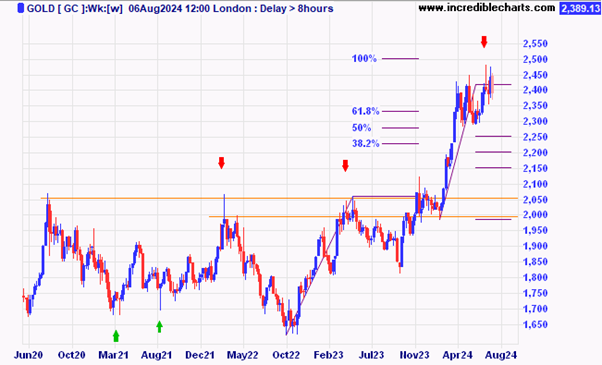
Markets are on tenterhooks for sure with a surprise rate rise from the Bank of Japan and higher than anticipated unemployment numbers out of the United States. It is also a seasonally weak time of year for most stock markets with the dreaded September and October when dramatic falls have taken place historically and when markets have tended to turn up after doing so. September is historically the worst month for Australian stocks down by an average of 2 per cent. Interesting times ahead.
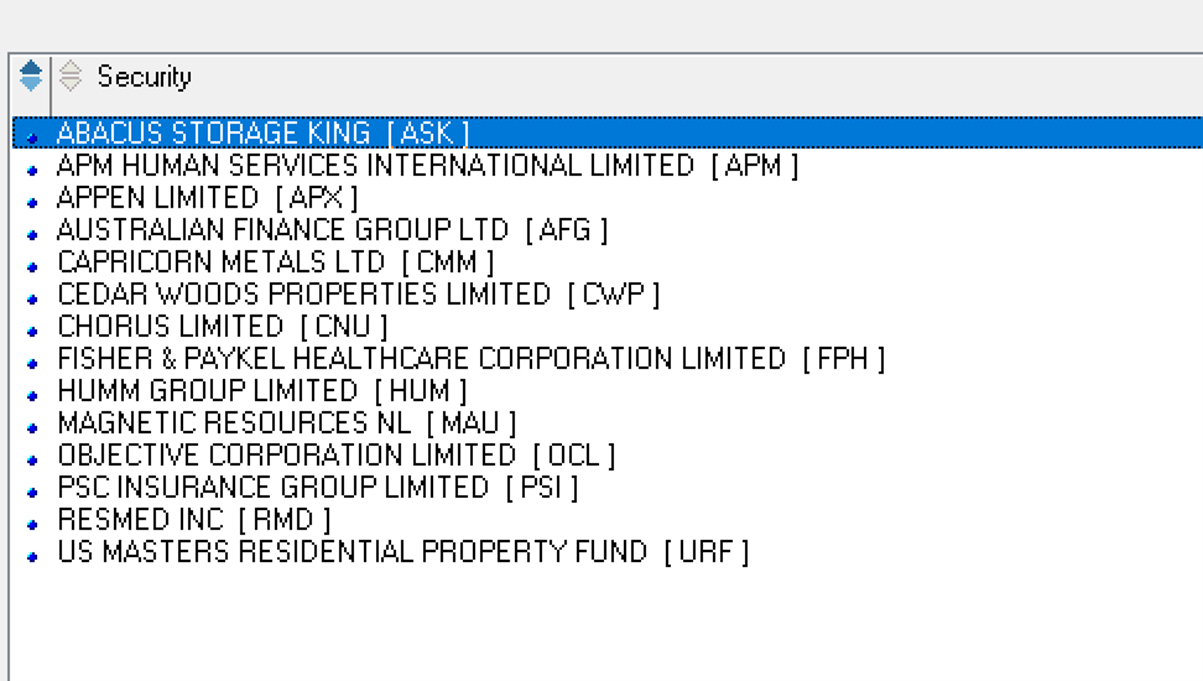
Resmed was one of only 14 stocks in the 500 stocks of the All-Ordinaries index to post a new 63 day high over the past three days.
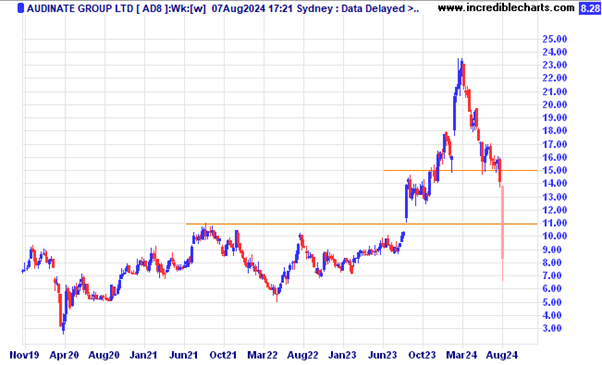
Audinate fell heavily after their latest results came in under expectations.
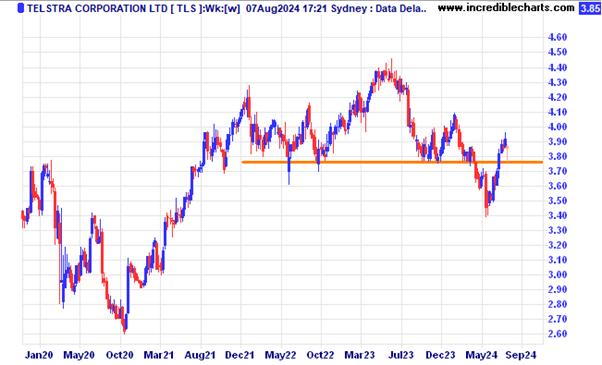
Bigger utility type stocks like Telstra looked to hold steadier as others fell.
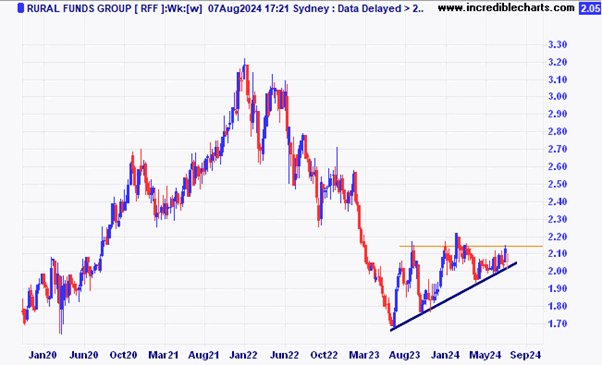
Rural Funds Group holds the up-trend line.
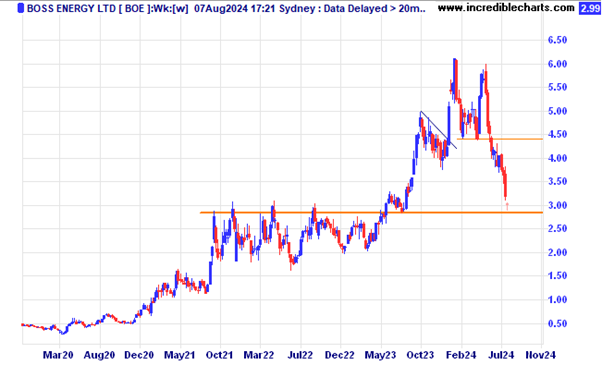
Uranium stocks have not done well recently.
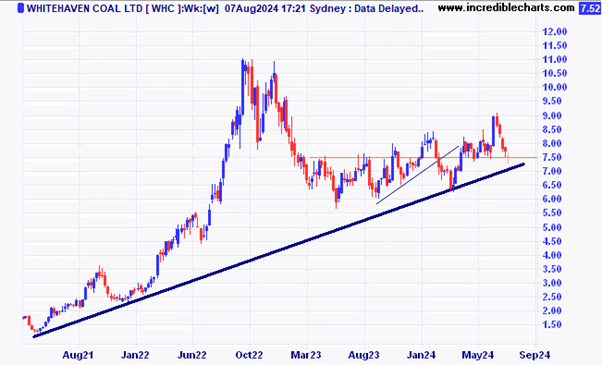
Whitehaven Coal is above the trend line for now. Can it stay there? With the recent purchase cost of the BHP mines close to what the entire company is worth now something is a bit out of “whack”.
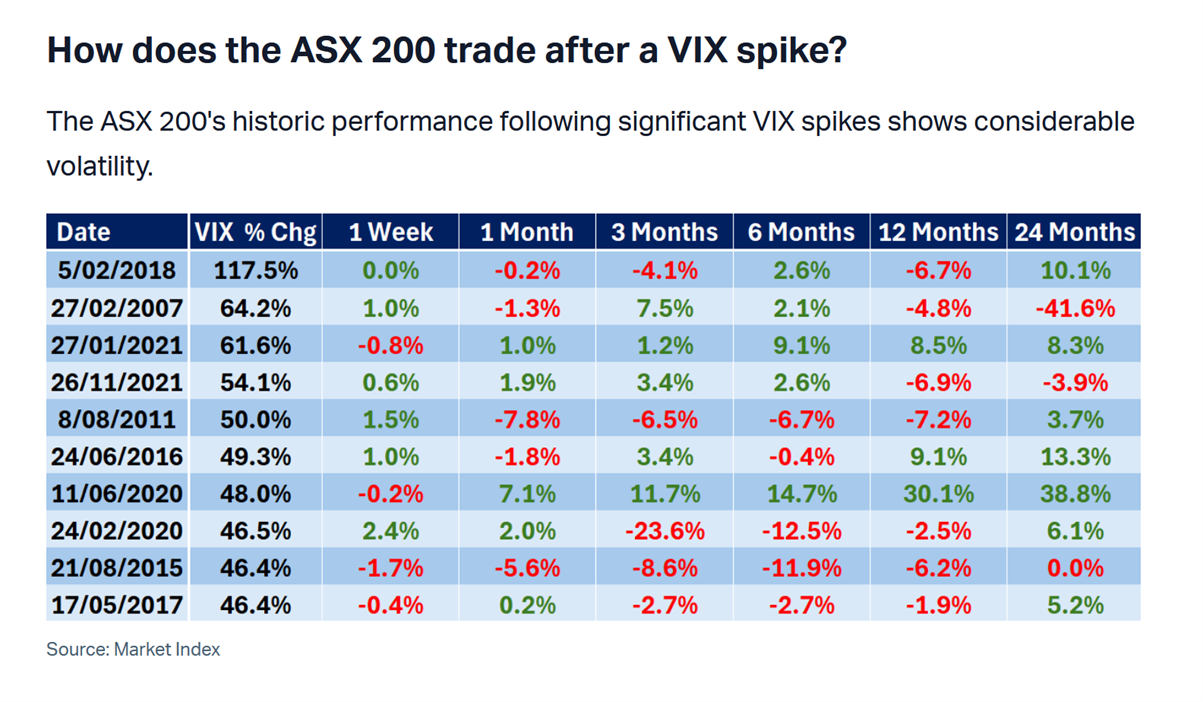
Markets do not like volatility and the table below shows that a year after a spike in volatility the market tends to be lower with two years later generally more positive.
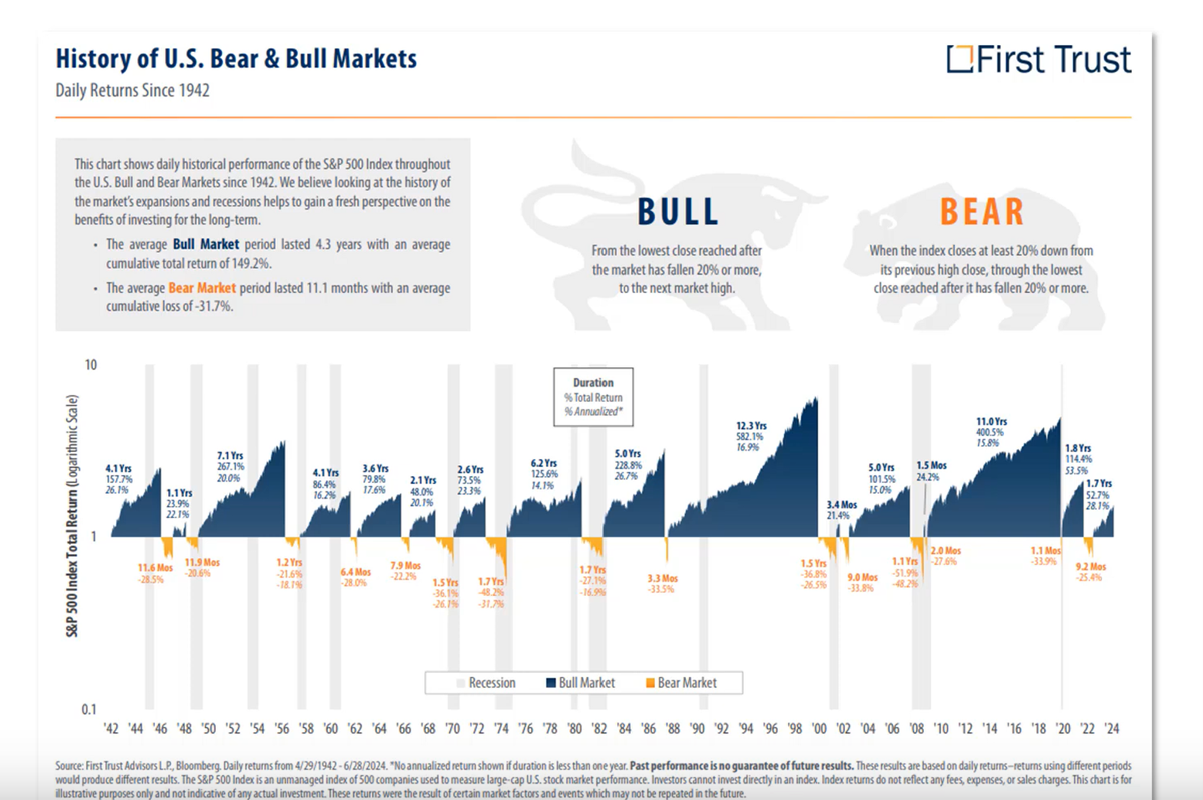
An historic look at Bull and Bear markets in the US reminds us that bear markets do not usually last long.
Disclaimer: The commentary on different charts is for general information purposes only and is not an invitation to trade. Trading is risky and individuals should seek Professional counsel before making any financial decisions. Many thanks to Incredible Charts.com software for most of the charts used in the column.
To order photos from this page click here


