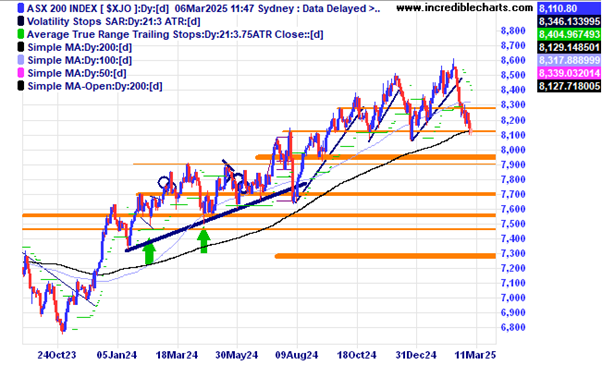
The local market is holding above the support zone and 200 day moving average for now. Some stimulus measures out of China has helped the resource stocks today.
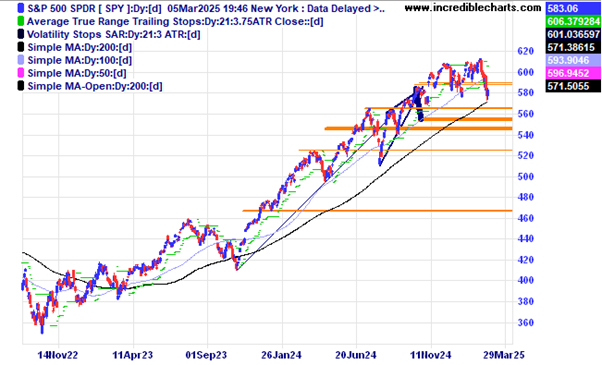
The US stock market measured by the SPY ETF is holding around the 200 day moving average for now.
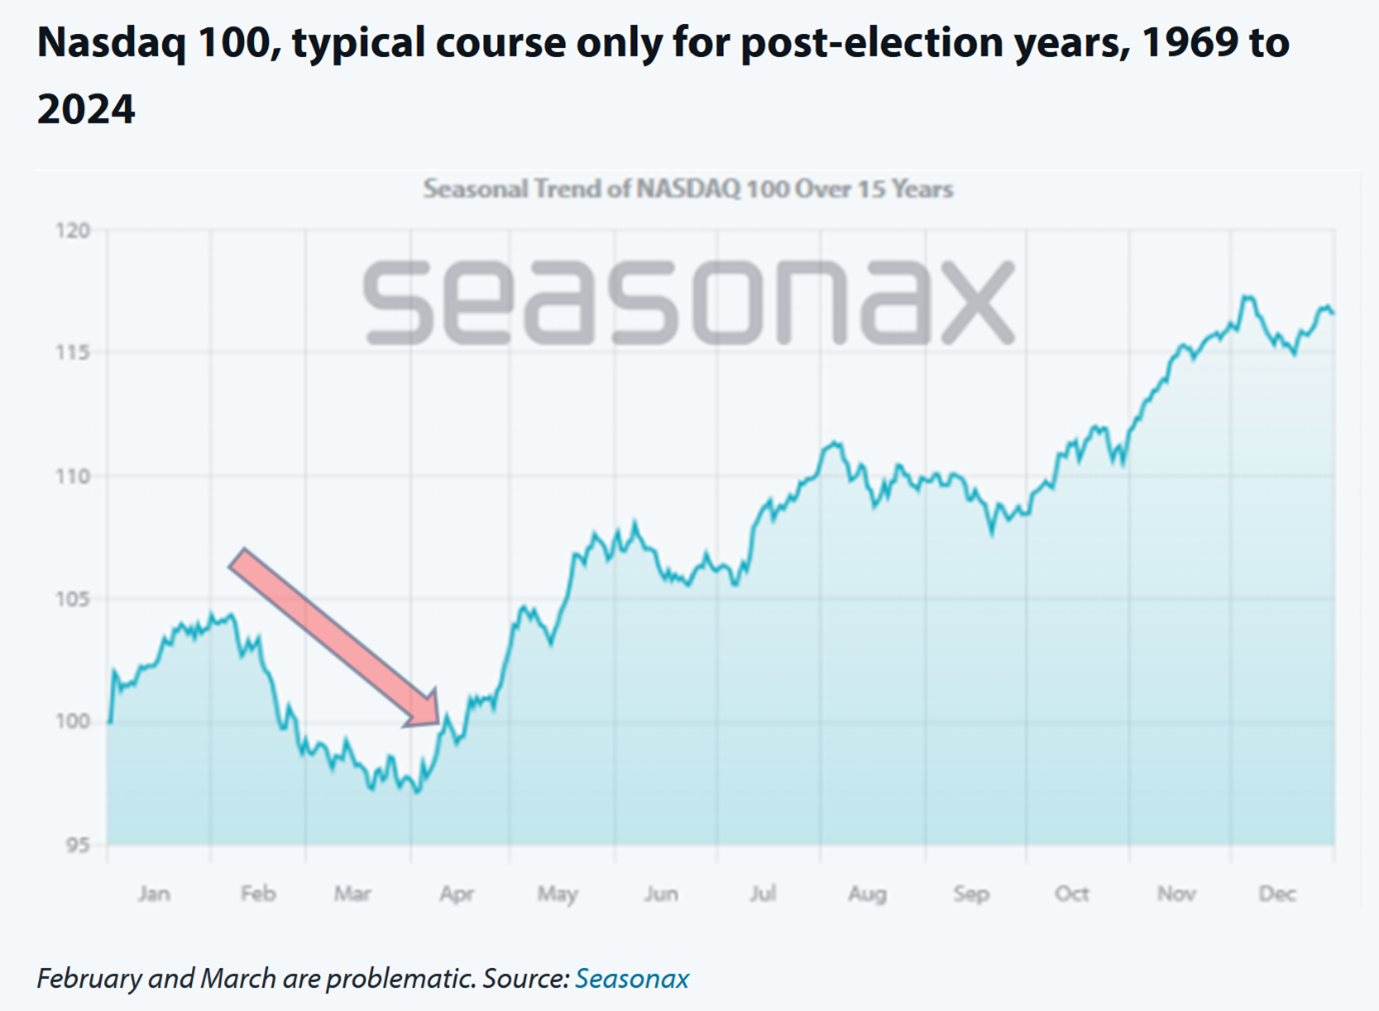
This is one representation of the average year after an election for the US Nasdaq index showing a low around late March before a seasonally strong April kicks in. Will tariffs wreck the party?
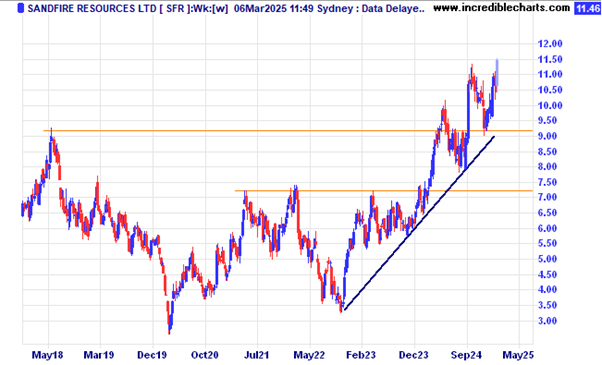
Copper miner Sandfire has made a nice rebound off the trend line and close to the horizontal support zone.
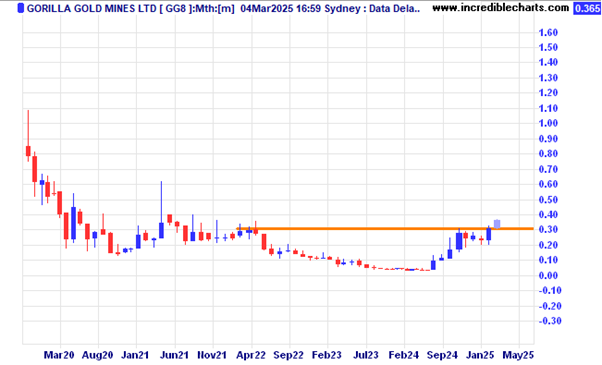
Gorilla Gold Mines looks to be moving out of the recent sideways consolidation.
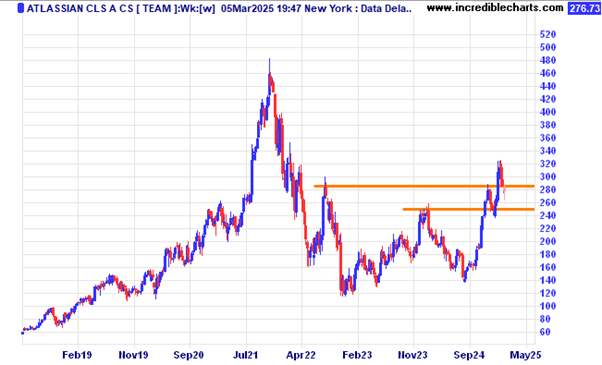
The US listed and Australian founded Atlassian looks to be finding some support around these levels.
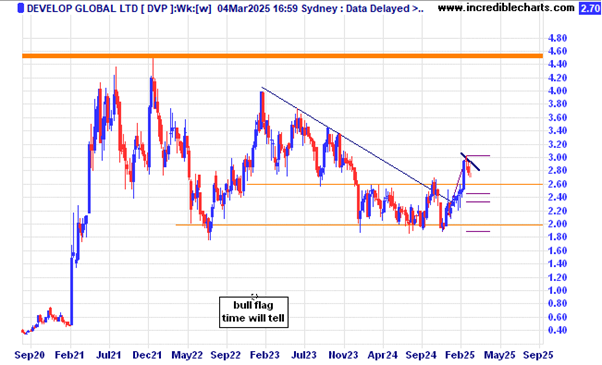
Develop Global looks to be forming a bullish flag pattern.
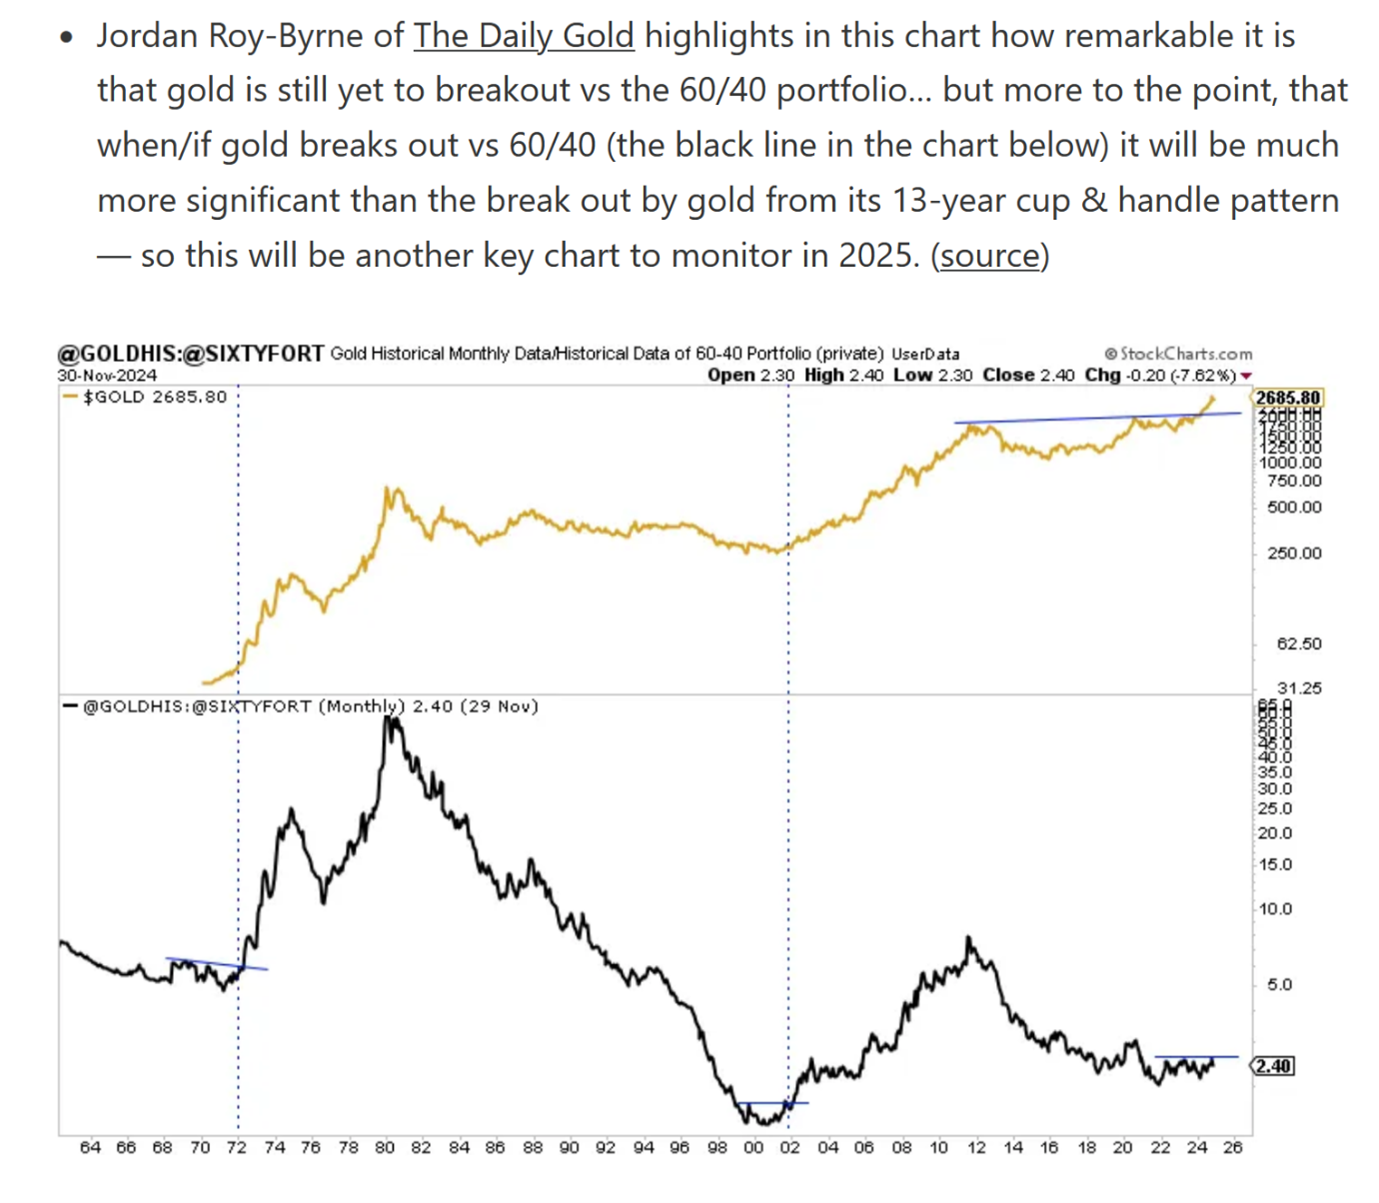
The following is one analysts view of a possible gold price rise scenario. It compares the standard 60/40 portfolio against the price of gold that acts as a signal of sorts. Correlation is not necessarily causation.
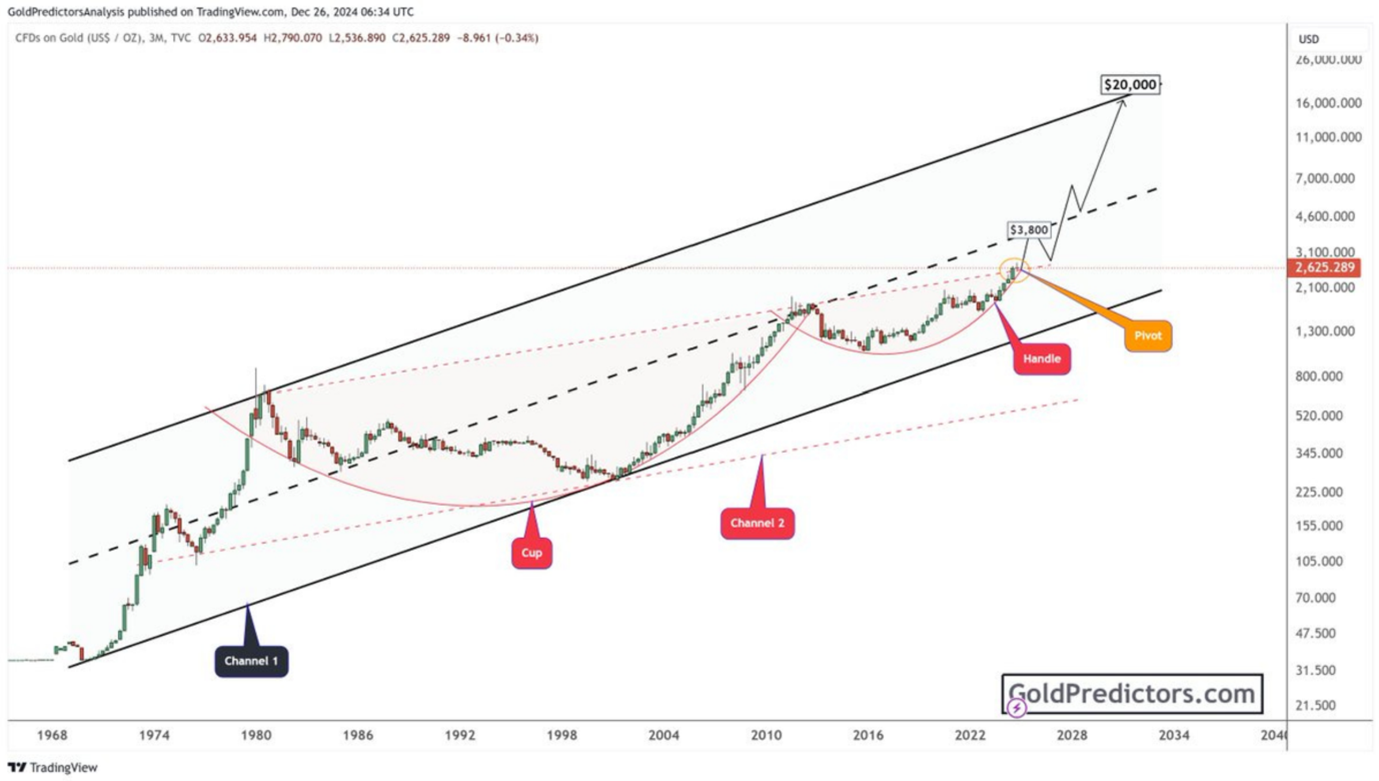
This is yet another look at how a different analyst is looking at the possible price projection for gold hitting up near $20,000 in the 2030’s. With all this bullishness for gold it may well be the current run needs a pause.
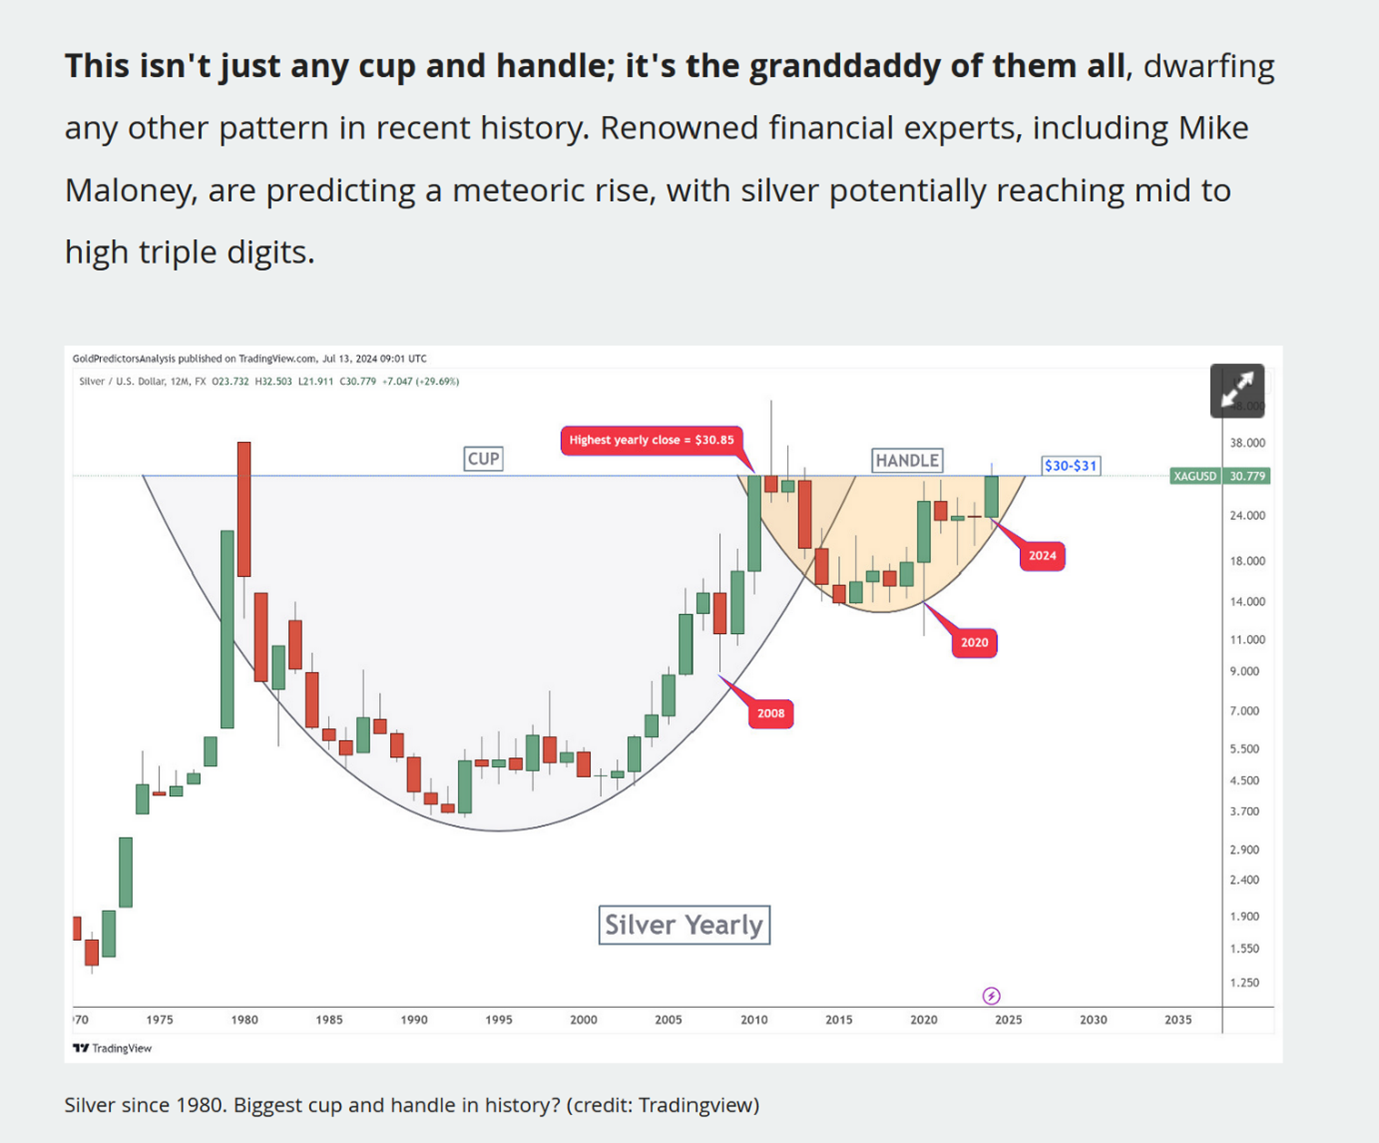
This is a massive cup and handle pattern on the price of silver over 50 years with projections of a price hitting the middle triple figures.
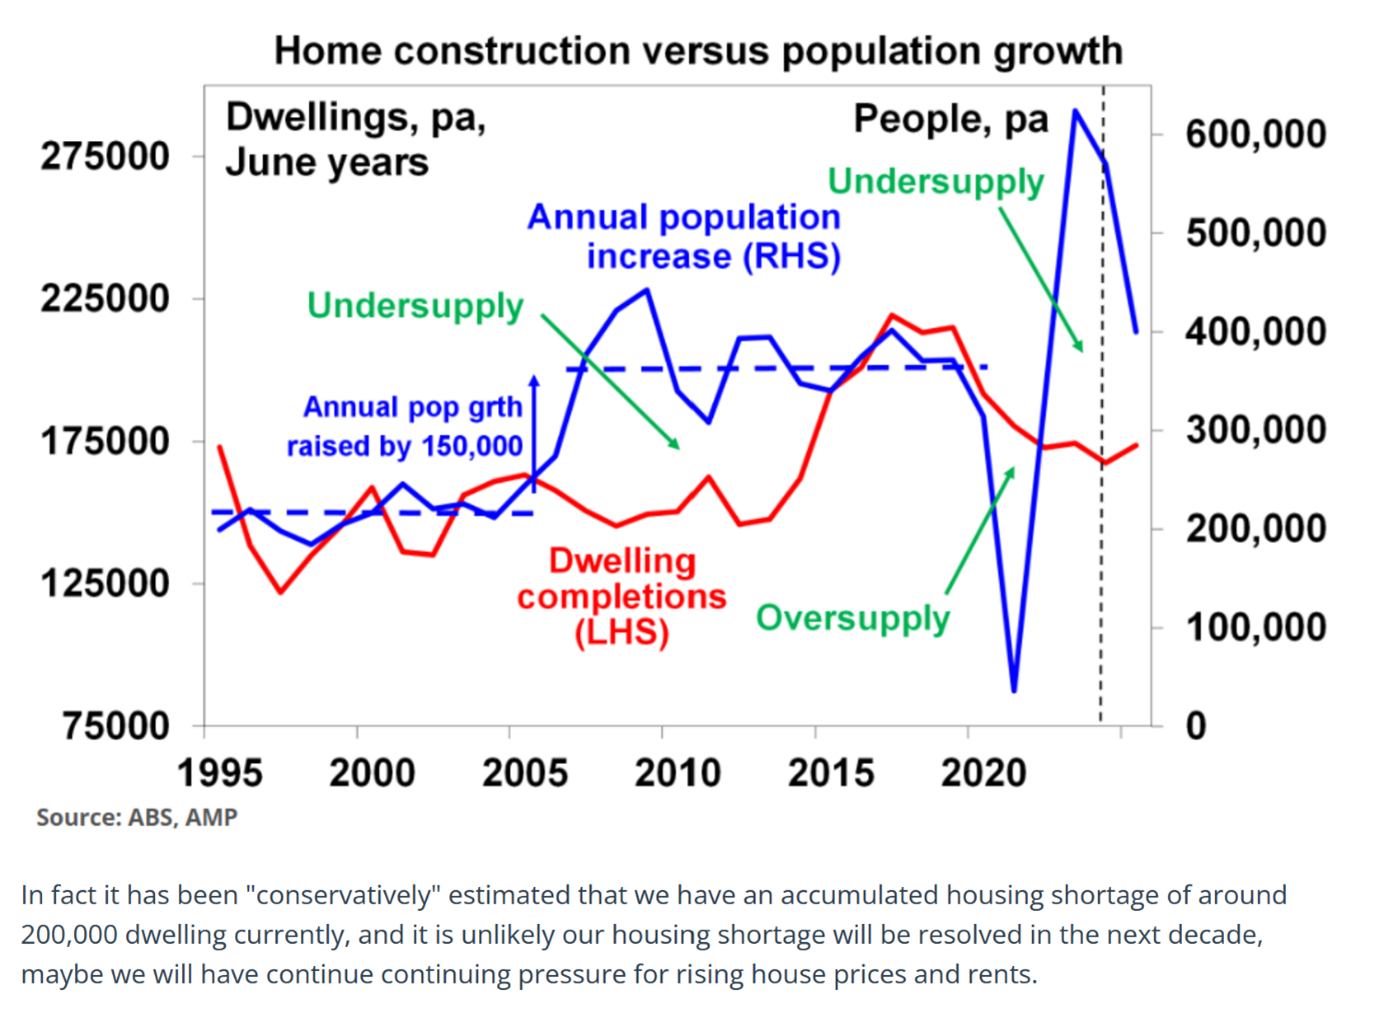
A look at the housing supply versus the growth in population.
Disclaimer: The commentary on different charts is for general information purposes only and is not an invitation to trade. Trading is risky and individuals should seek Professional counsel before making any financial decisions. Many thanks to Incredible Charts.com software for most of the charts used in the column. Cheers Charlie.
To order photos from this page click here


