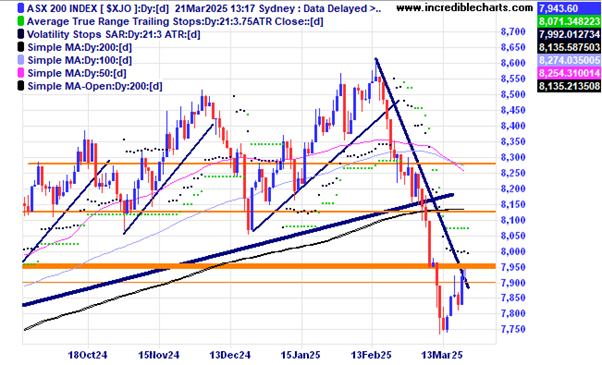
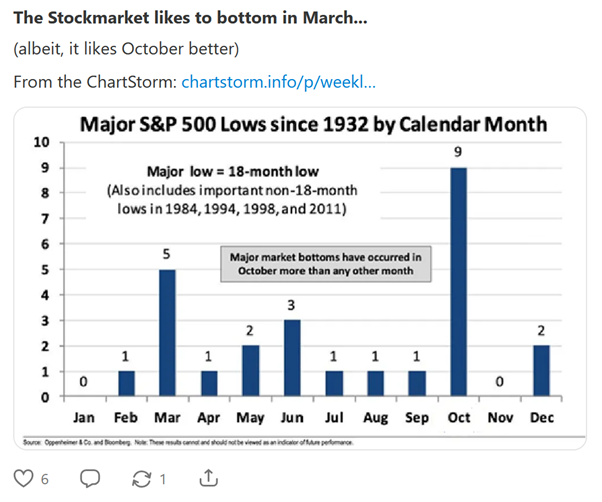
The local market is making a bit of a bounce off these levels forming a small ABC type pattern. Will this be the low or simply the reversal of a very oversold market. Time will reveal all and with the month of March producing quite a few lows over the years it could be up from here. The Trump retaliatory tariffs due to come in early April could be detrimental to some markets.
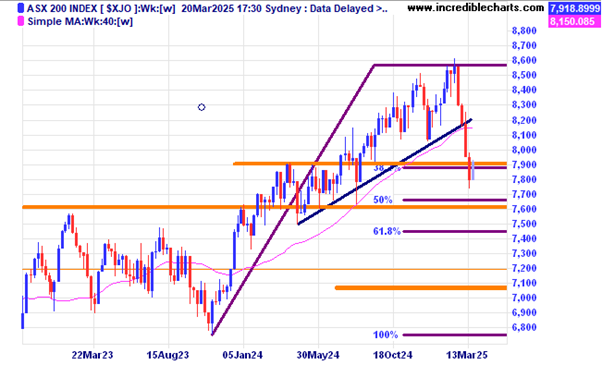
The weekly chart of the local index shows that the 50 per cent retracement level is not far away.
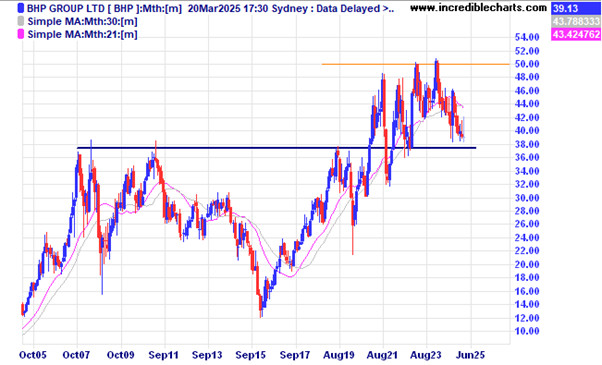
BHP on a monthly chart shows price is close to the lows of the current large sideways range.
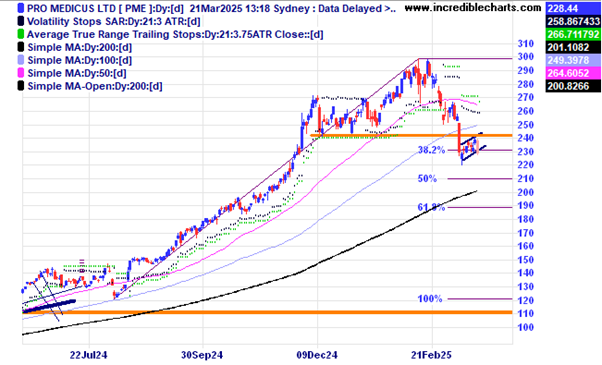
The long run of Pro Medicus looks to be ending with a break and re-test of a major support zone and yet the stock still trades on a PE ratio over 200.
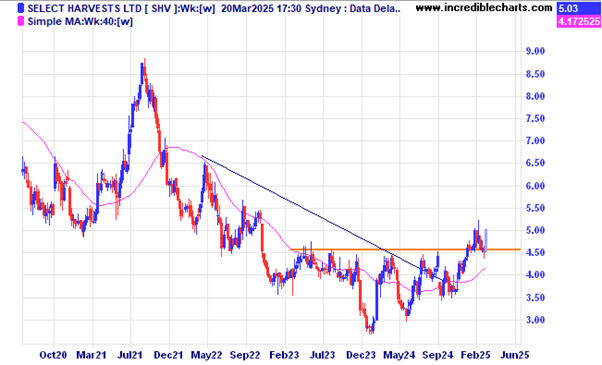
Select Harvest is one of a few stocks holding up well in the current sell off.
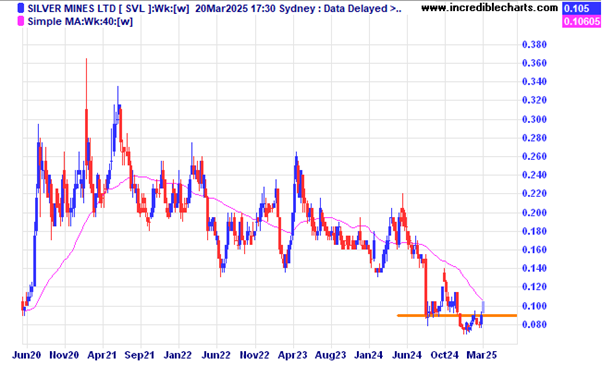
Silver Mines price has pushed up through a resistance zone.
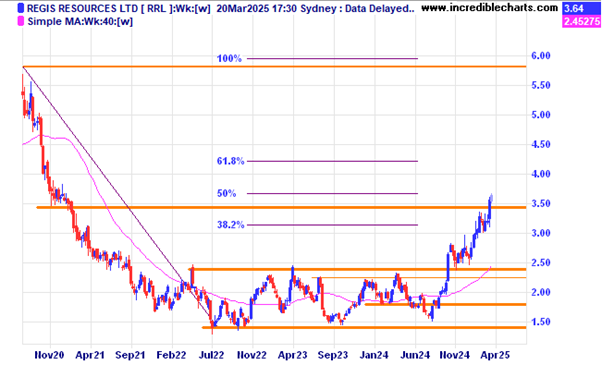
Regis Resources looks to be around half-way up to the ultimate target. Will it make it?
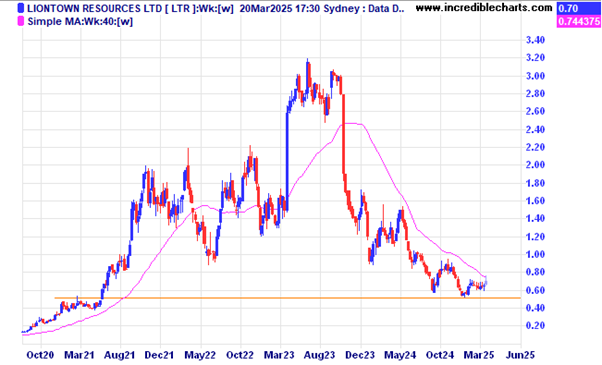
A few lithium stocks like Liontown have been moving off the lows recently.
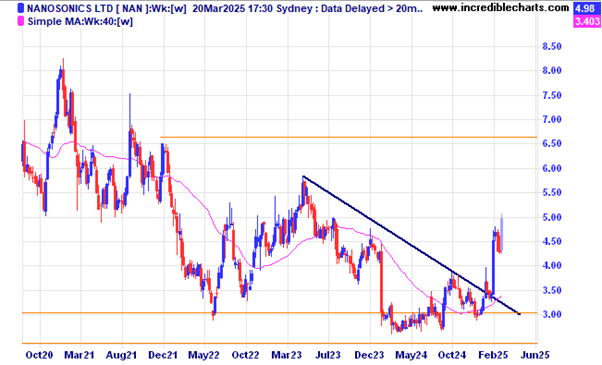
Nanosonics is moving up after a favourable FDA report on one of their products.
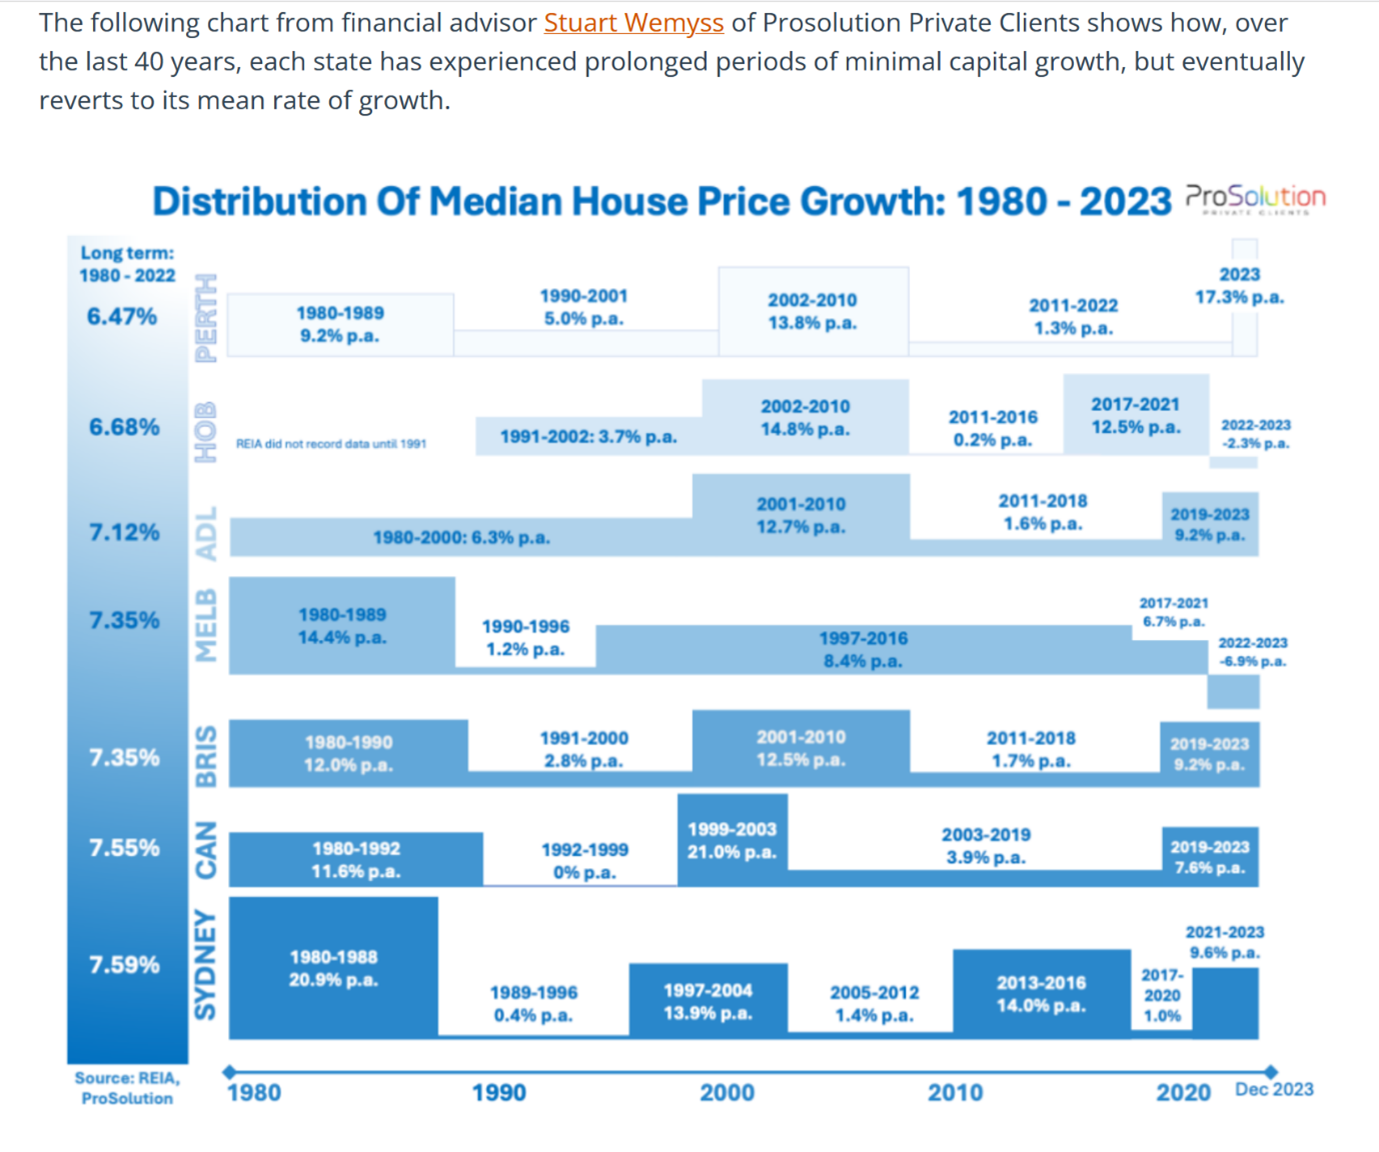
An interesting look at how Australian median house prices have changed in different capital cities over the past 40 plus years. Perhaps some good new for Melbourne property holders is on the way some time down the track.
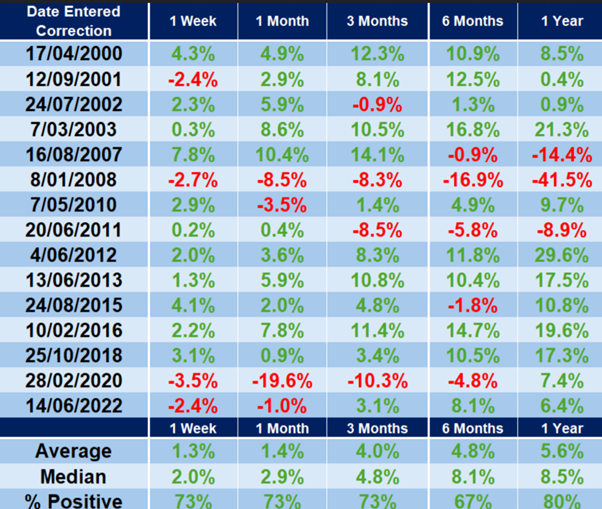
A table of what has happened after a ten per cent correction in US markets since 2000.
This table shows that stocks like to bottom in March as well as the dreaded October in the US S@P 500 index.
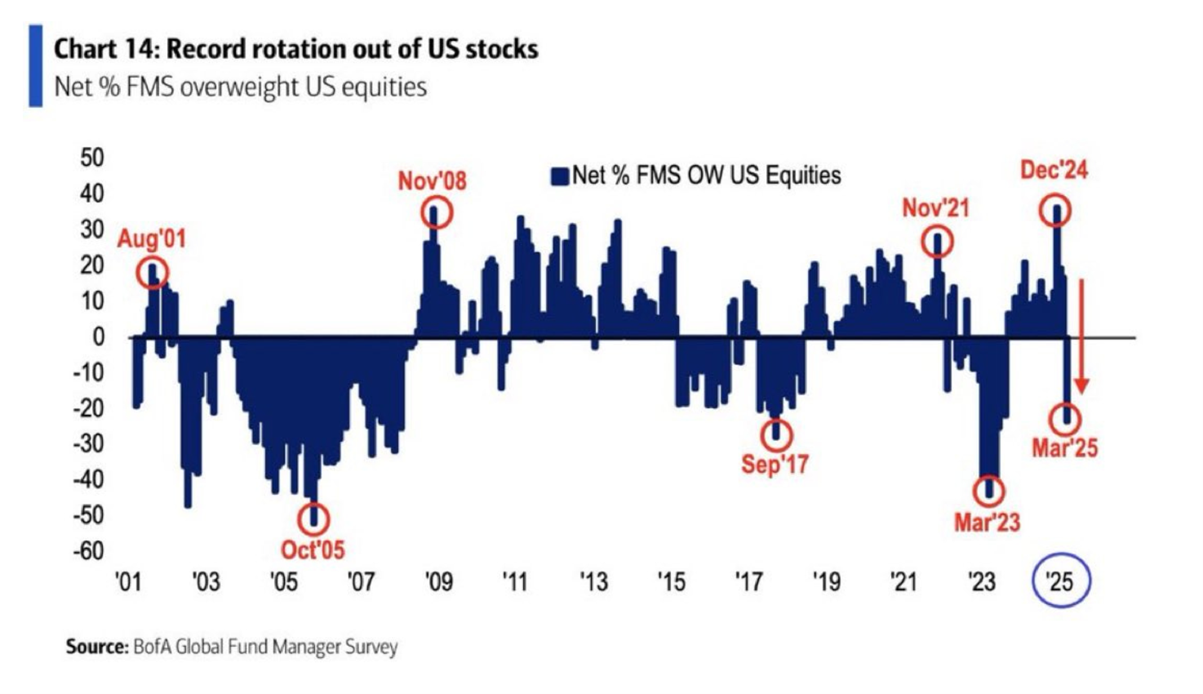
In the past few months there was a substantial outflow of funds from US stocks.
Disclaimer: The commentary on different charts is for general information purposes only and is not an invitation to trade. Trading is risky and individuals should seek Professional counsel before making any financial decisions. Many thanks to Incredible Charts.com software for most of the charts used in the column. Cheers Charlie.
To order photos from this page click here


