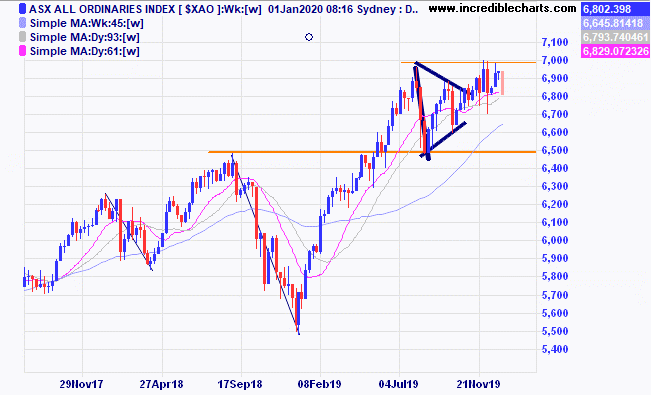
The local market ended the year on a slightly sour note falling 100 points on the last trading day of 2019 and closing down on the week. The All Ordinaries index is having trouble getting past that 7,000 level.
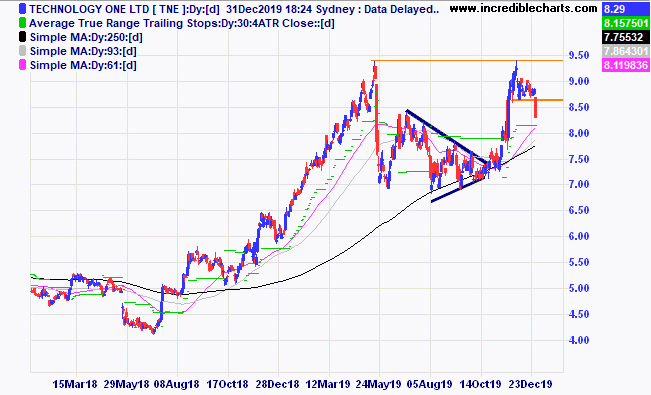
We were stopped out of Technology One after price briefly touched the resistance zone then fell away below our stop loss level.
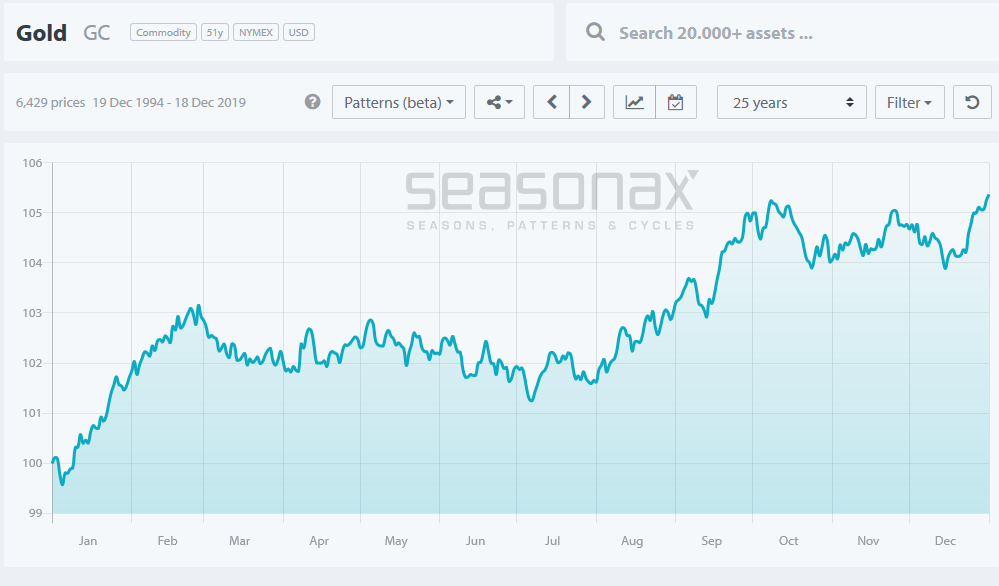
The gold price seasonal has come into play and a few Aussie gold stocks now show good risk reward and trade possibilities.
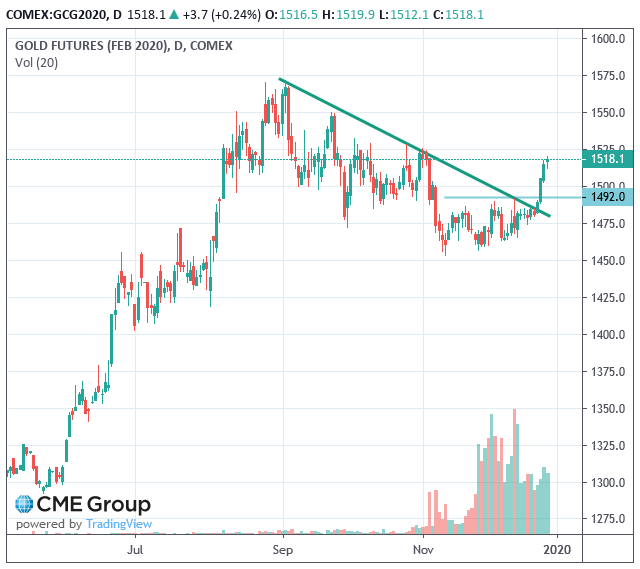
The gold chart has a potential bull flag pattern forming and a $1900 target after and if, it can clear overhead resistance at $1,556. Only negative is the COT report.
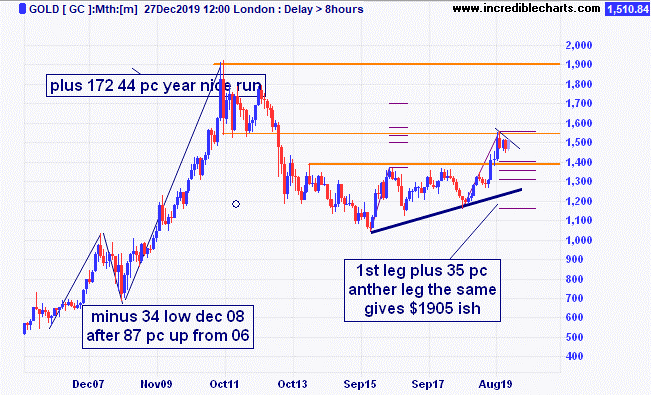
Gold futures builds then pops. A retracement to the $1,490’s could give a good entry point. Lower than normal holiday volume at the breakout is not ideal. Watching and ready to act.
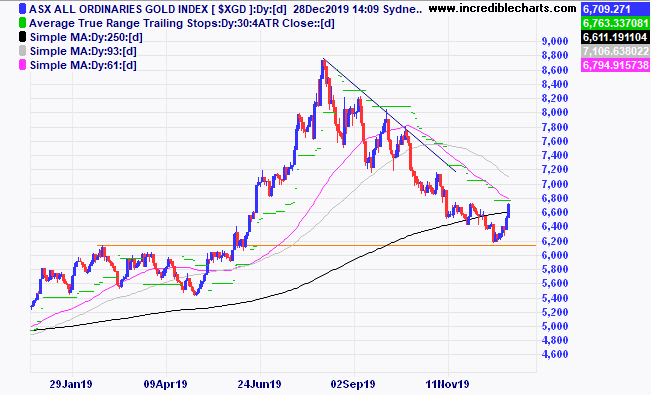
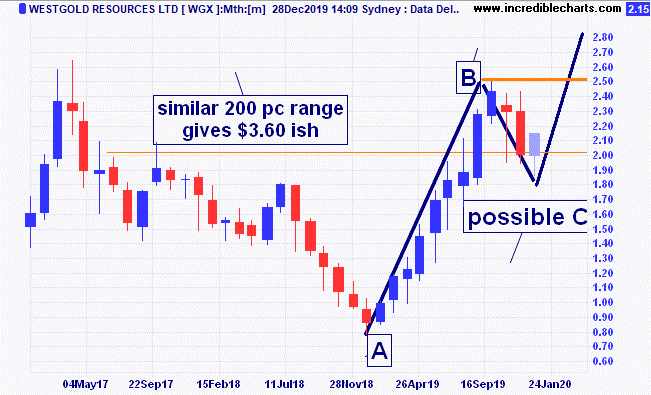
The local gold index has also been moving up from an area of likely support. An ABC retracement pattern could set things up nicely for a decent run up.
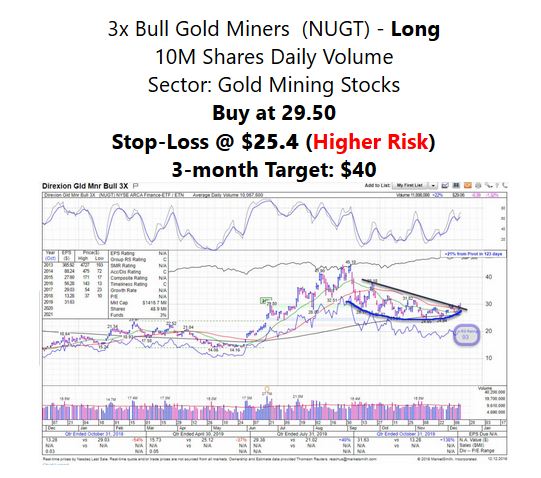
A well-known American stock picker posted this online in mid-December.
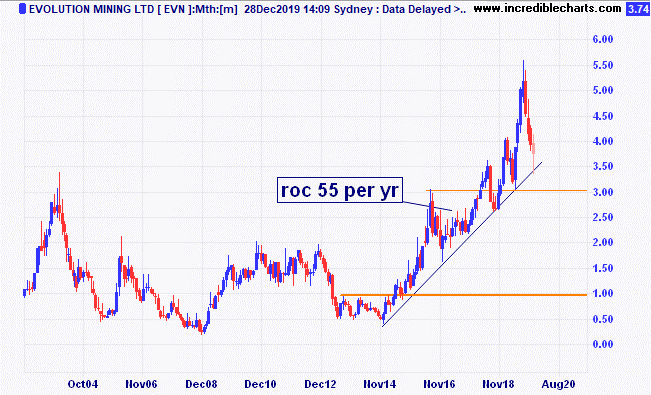
Evolution shows a nice spike bounce from the trend line, worry is drought could affect operations. Could be a longer- term proposition with a good Rate Of Change over time on the current trend line.
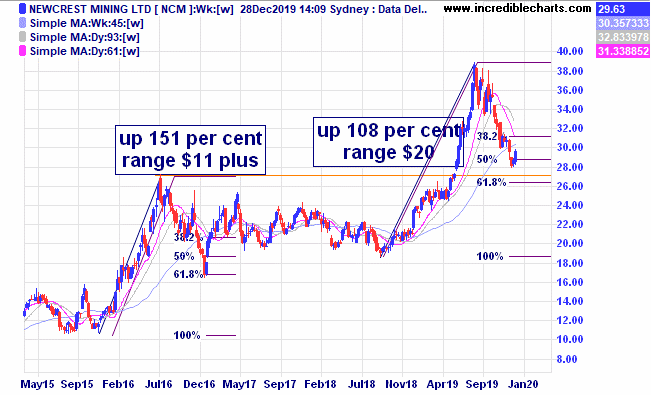
Newcrest Mining is the big daddy of the local gold stocks and goes for decent runs. Watch out for overhead resistance and the spike low on the monthly chart is a reasonable place for a stop. First target is old highs and would likely take part profits. Equal range target would be around $47 to $48. We added some to the “educational” portfolio on the 31st December.
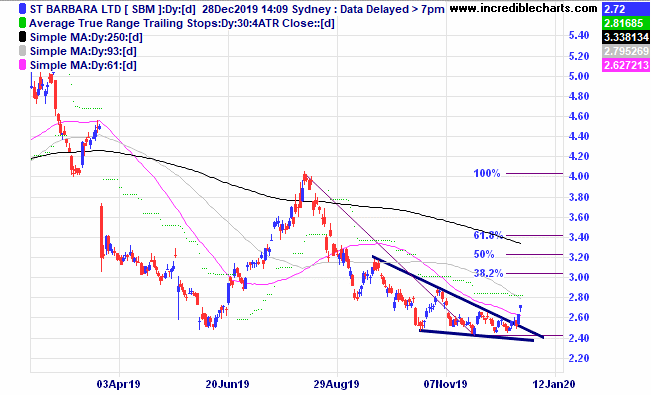
St Barbara has a high cost of production so profit increases are highly geared to the gold price so could be a bolter. No production upside slated and shows good patterns on multiple time frames.
Westgold Resources is also setting up on the monthly chart with a similar range up from here giving a nice possible risk reward ratio.
The anatomy of a potential trade is not something that Charlie often posts. After chatting to a few old friends over the break it became apparent that a lot of people do not think about their trades in a risk reward fashion.
For this example we will look at a trade set up for Newcrest Mining based on the monthly chart.
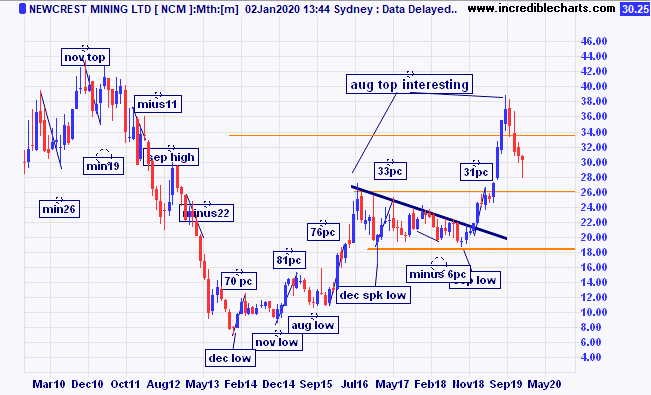
Entry would be above last month’s close at $30.83
Initial stop is at $27.73
Risk per share is $3.10
The initial target is close to the old highs at $38.00 making a possible $7. Win loss ratio just above 2.
The ideal target is close to 100 per cent of the last range up to around $48 a gain of around $17 from the entry for a win loss ratio of over 5.
To find the risk reward ratio you divide the risk amount (difference between likely entry and initial stop loss points) into the likely target you are looking at on a technical basis.
You never know how far a trade will run and having a trailing stop that follows the trade as profits increase is the usual thing to do. Charlie does not mind taking part profits when appropriate to keep some cash coming in and lowering the trade risk. You never know when a trade will turn against you.
Preliminary figures from last years trades show 74 entries and 94 trade exits, 20 where part profits were taken.
The Westgold trade had three different exits and is still a hold and will be one of the stocks carried over into the new portfolio along with CSL, Kogan, Wagners, Santos, Magellan and Newcrest.
Back to the Newcrest example. Now for the possible trade size. Maximum account risk is 1 per cent of $50,000 our new starting equity. So $500.
Divide initial risk of $3.10 into $500 you get 161 shares times $30.83 is $4,963 which exceeds our maximum trade amount. A full position is a bit too much for a $50k account so we went for an even 100 shares bought on the 31st December ( in anticipation of price moving above $31) and yes it was before price moved above the monthly high.
A conservative trading strategy would be to exit a third of the holding on hitting the initial target, put a trailing stop on the rest and see how far it goes.
Table
Security | Units bought (sold) | Date | Open price/ From last table | Current/close | $ gain/loss |
Buy CSL 3/12/18 at $183 c/f 9/1 at $192.31 | Bought 15 at $192.31 | 9/1/2019 | $284.72 | $275.76 | -$134.40 |
Bought Westgold | Bought 1,000 at $1.03 | 7/2/2019 | $1.99 | $2.29 | +$300.00 |
Bought Qube | Bought 1,000 at $3.04 | 26/6/2019 | $3.33 | $3.29 | -$40.00 |
Bought IPH
| Bought 400 at $8.55 | 19/8/2019 | $8.59 | $8.20 | -$156.00 |
Bought NextDC | Bought 400 at $6.55 | 28/8/2019 | $6.87 | $6.58 | -$116.00 |
Buy Reliance Worldwide | Bought 800 at $3.70 | 28/8/2019 | $4.24 | $4.04 | -$160.00 |
Buy Lifestyle Communities | Bought 300 at $7.20 | 4/9/2019 | $8.45 | $9.21 | +$228.00 |
Bought Santos
| Bought 350 at $7.80 | 16/9/2019 | $8.40 | $8.18 | -$77.00 |
Bought Kogan | Bought 250 at $6.25 | 25/9/2019 | $7.21 | $7.59 | +$95.00 |
Buy Wagners | Bought 1,500 at $1.75 | 16/10/2019 | $2.46 | $2.60 | +$210.00 |
Buy Technology One | Bought 400 at $7.45 | 24/10/2019 | $8.96 | Stopped 31/12 at $8.55 | -$194.00 |
Bought Platinum Asset Management | Bought 700 at $4.40 | 6/11/2019 | $4.65 | $4.52 | -$91.00 |
Bought Kogan | Bought 250 at $7.35 | 18/11/2019 | $7.21 | $7.59 | +$95.00 |
Bought Audinate | Bought 400 at $8.30
| 22/11/2019 | $8.05 | $7.94 | -$44.00 |
Bought Integrated Research | Bought 900 at $3.20 | 28/11/2019 | $3.19 | $3.26 | +$63.00 |
Bought Beach Energy | Bought 1,000 at $2.55
| 9/12/2019 | $2.67 | $2.51 | -$160.00 |
Bought Select Harvests | Bought 300 at $8.54 | 11/12/2019 | $8.48 | $8.39 | -$27.00 |
Bought South32
| Bought 1,000 at $2.80 | 11/12/2109 | $2.88 | $2.70 | -$180.00 |
Bought Magellan Financial Group | Bought 40 at $57.50 | 18/12/2019 | $57.50 | $56.95 | -$22.00 |
Bought Newcrest Mining | Bought 100 at $30.20 | 31/12/2019 | $30.20 | $30.25 | +$5.00 |
|
|
|
|
|
|
Start 7/1/2019 $50,000.00 | Open balance $74,874.90 |
|
|
| $74,874.90 |
| Gains/losses week -$405.40 |
|
|
| -$405.40 |
End 31/12 2019 | Current total $74,469.50 |
|
|
| $74,469.50 |
Brokerage at $30 per round turn added when sold. | Less buy/ close prices and Margin $54,976.40 |
|
|
| $54,976.40 |
Prices from Tuesday’s close or 6am for US | Cash available $23,227.10 |
|
|
| $23,227.10
|
Disclaimer: The commentary and trading positions taken are for educational purposes only and are not an invitation to trade. Trading is risky and individuals should seek Professional counsel before making any financial decisions. Many thanks to Incredible Charts.com software for most of the charts used in the column.
Monitor, measure, manage and maximise…
All the best for the coming year, Cheers Charlie.
To order photos from this page click here


