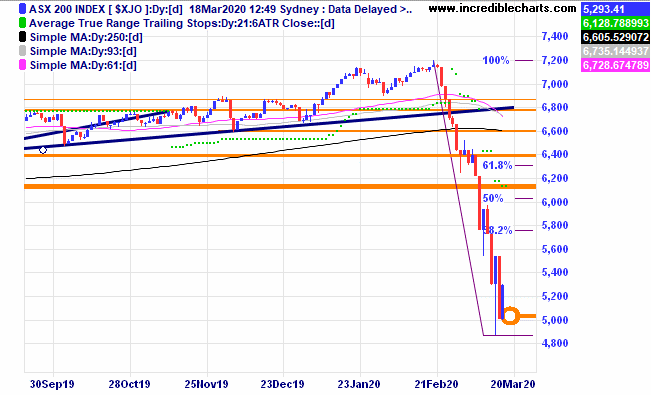
The uncertainty over how far and what impact the Covid19 virus will take on the health of the community and the side-effects of various travel and social distancing measures is taking a toll on investor confidence and with months of uncertainty over how things will unfold volatility is certain to continue. The local market has shown very few positive days over the past two weeks, the lower orange horizontal line shows where the market is at the time of writing.
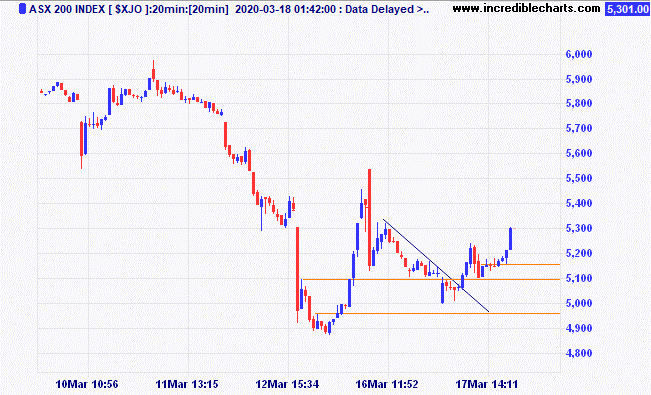
This twenty-minute chart of the ASX 200 shows how some day traders have been taking advantage of the increase in volatility. There also comes with it an increased risk and again today some providers have increased the margins on certain products.
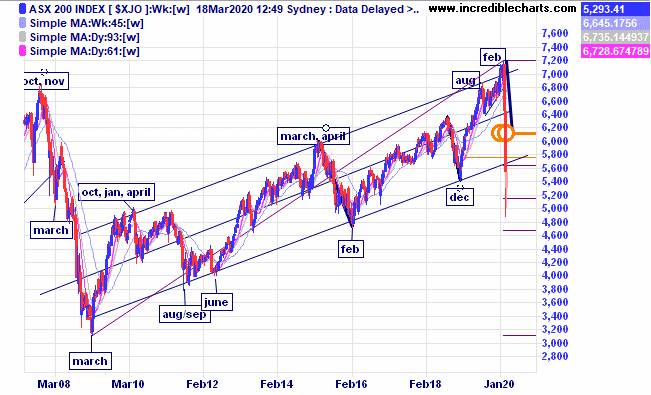
The current weekly chart shows how this downturn has been the most severe since 2008 and has broken the lower uptrend line. A 50 per cent drop would see the index reach around 3,600 points. At some point a retracement back up to that lower trendline will occur and it could become a zone of resistance for another leg down. Time will tell.
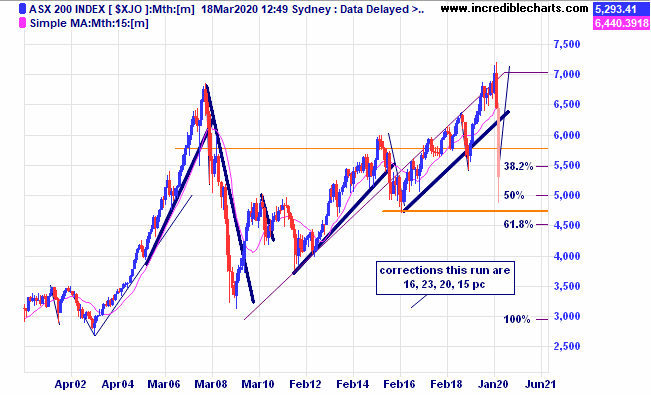
At some point the volatility and panic within markets will subside and markets will again start to trend. When is the great unknown? Below is the monthly chart of the 2008 market meltdown and the subsequent choppy rise. More than a few investors see the current turmoil as a buying opportunity to bolster their portfolios. Patience is a key along with a predetermined plan.
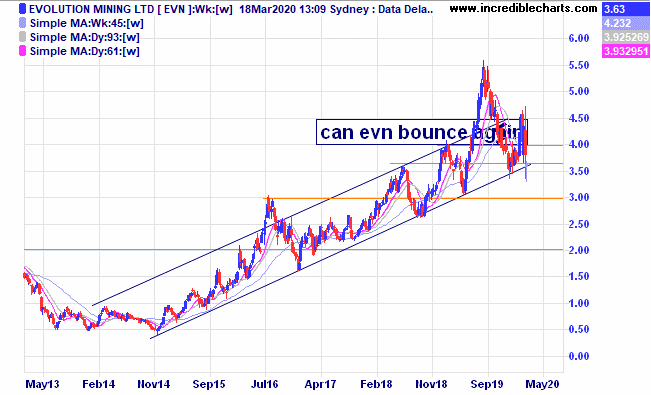
We were stopped out of our gold stocks near the lows before they reversed. Ouch, it happens sometimes and we are looking to re-enter gold stocks at some point. Recent media comments suggest selling by some gold funds to maintain liquidity caused the sell-off.
Charlie will continue to monitor the market and take trades where the risk reward equation is in our favour.
Table
Security | Units bought (sold) | Date | Open price/ From last table | Current/close | $ gain/loss |
Buy CSL 3/12/18 at $183 c/f 9/1 at $192.31 c/fwd 3/1 at $280 | Bought 10 at $192.31 9/1/2019 | 9/1/2019 | $308.97 | $296.90 | -$120.70 |
Bought Westgold c/fwd 3/1 at $2.33 | Bought 1,000 at $1.03 7/2/2019 | 7/2/2019 | $1.87 | Sold 12/3 at $1.60 | -$300.00 |
Bought Magellan Financial Group c/fwd 3/1 at $59.00 | Bought 40 at $57.50 18/12/2019 | 18/12/2019 | $48.64 | $42.02 | -$264.80 |
Bought Capitol Health | Bought 8,000 at 25.5c | 5/2/2020 | 26.5 | 22.5 | -$320.00 |
Bought Evolution | Bought 600 at $4.50
| 19/2/2020 | $4.39 | Sold 16/3 at $3.40 | -$624.00 |
Bought Bellevue Gold | Bought 4000 at 58c | 21/2/2020 | 48c | Sold 11/3 at 45c | -$150.00 |
Bought Lifestyle
| Bought 300 at $8.40 | 2/3/2020 | $8.52 | $6.90 | -$486.00 |
Buy GEAR ETF
| Buy 200 at $18.50 | 10/3/2020 | $19.80 | Sold 100 11/3 at $18.80 Sold 100 12/3 at $17.50 | -$130.00
-$260.00 |
Bought 5 ASX 200 cfd’s
| Bought at 5,050 | 13/3/2020 | 5,035 | Sold 5 at 5,384 Close of 13/3 | +$1,715.00 |
|
|
|
|
|
|
Start 2/1/2020 $50,000.00 | Open balance $56,636.40 |
|
|
| $56,636.40 |
Stock c/fwd 3/1 $18,427.50 | Gains/losses week -$940.50 |
|
|
| -$940.50 |
| Current total $55,695.90 |
|
|
| $55,695.90 |
Brokerage at $30 per round turn added when sold. | Less buy/ close prices and Margin $9,889.00 |
|
|
| $9,889.00 |
Prices from Tuesday’s close or 6am for US | Cash available $45,806.90 |
|
|
| $45,806.90
|
Disclaimer: The commentary and trading positions taken are for educational purposes only and are not an invitation to trade. Trading is risky and individuals should seek Professional counsel before making any financial decisions. Many thanks to Incredible Charts.com software for most of the charts used in the column.
Monitor, measure, manage and maximise… Cheers Charlie.
To order photos from this page click here


