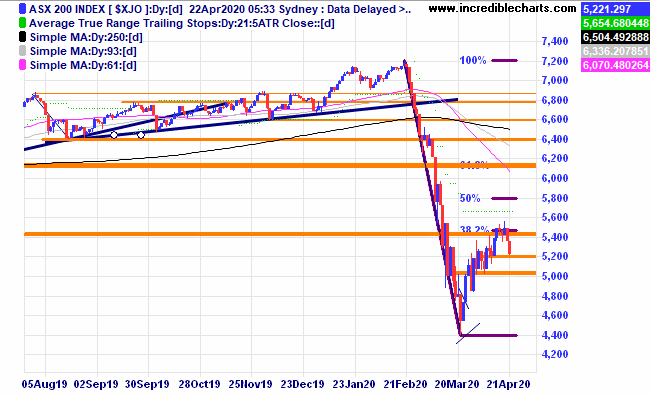
The local market closed lower yesterday and with the ructions in the world oil market adding to COVID-19 woes we could head down for a while. Time will tell.
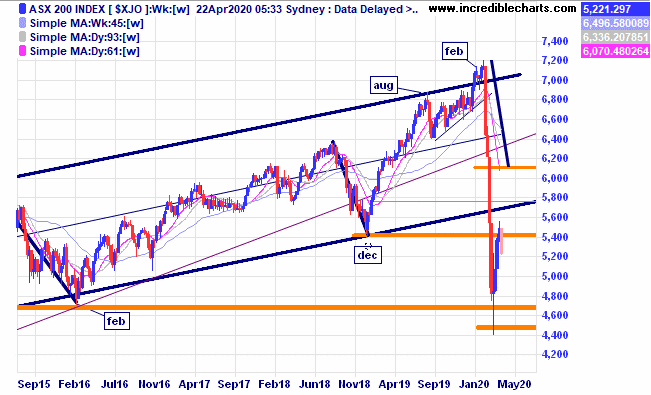
The longer-term weekly chart shows the break below the lower trend channel line, move significantly lower, bounce back from a support zone and move back up close to the original breakdown. A higher low and some bullish indicator divergence would make for a “classic” pattern to consider a re-entry back into the broader market. Another possibility is the market forms a new low, nobody knows for sure how this will pan out.
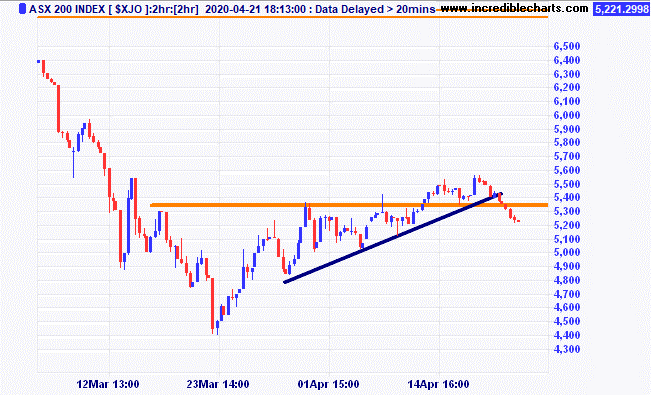
The two-hour chart showing a break below the trendline and a move below the last swing low. A classic entry point and we sold eight ASX cfd’s in anticipation of a further move down and sold half our stake this morning to bank some profit and lower our risk.
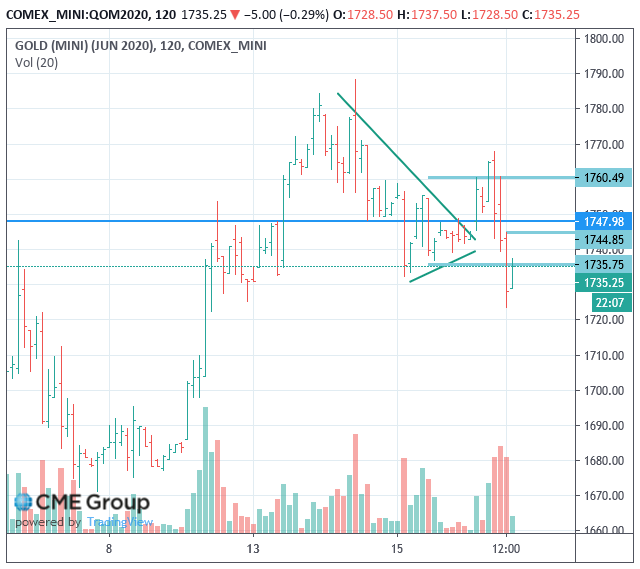
The chart from last week looking at a possible trade set-up in gold.
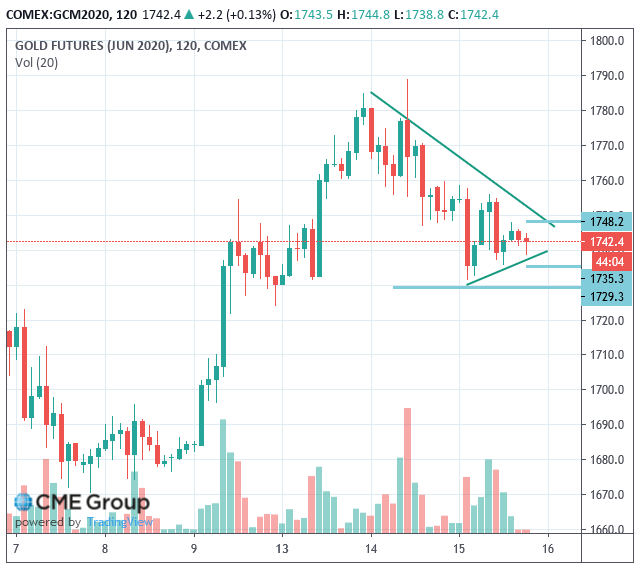
How that market unfolded and after buying and selling two mini contracts ended up back where we started for a break-even type trade.
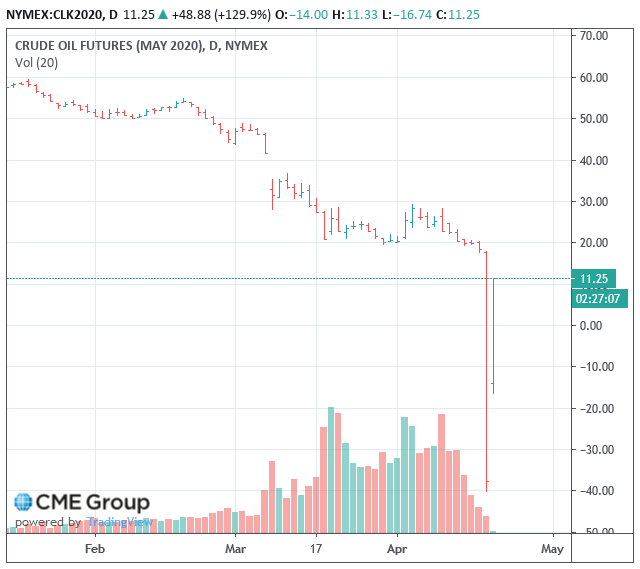
This oil chart shows a very big day down in the futures prices for oil down to a minus $40 per barrel low only to rebound to $11 per barrel the next day. The very full storage capability for oil has led buyers to insist some sellers pay for the storage, hence the minus price. Shows how crazy some world markets are becoming.
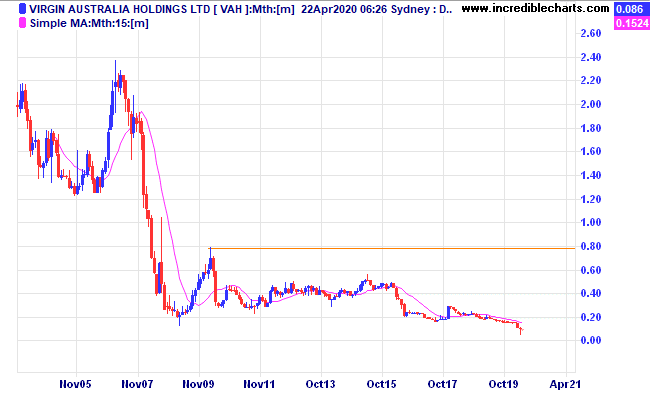
The tale of woe that is the Virgin Australia share price
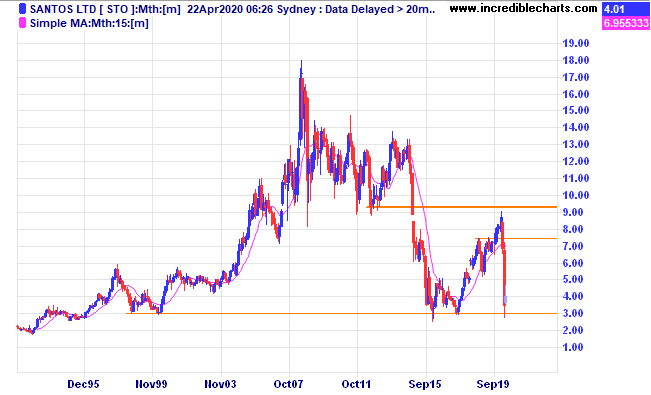
The price of Santos briefly fell back to the 2017 lows and 1998 levels around $3. Can price recover from here as it has it the past?
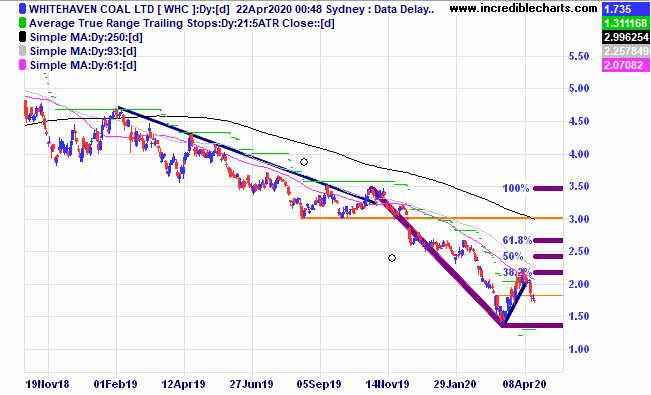
Whitehaven Coal only reversed around 38 per cent of the move down before stumbling in what could be seen as a sign of weakness. We have our stop in place.
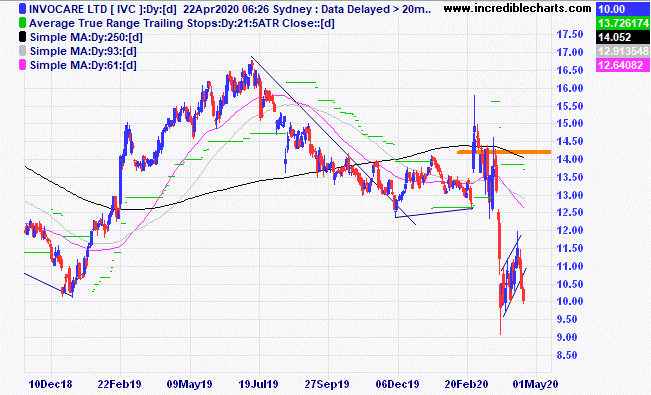
The price of Invocare looks to have made a bearish flag pattern and we will exit today and look for better trades.
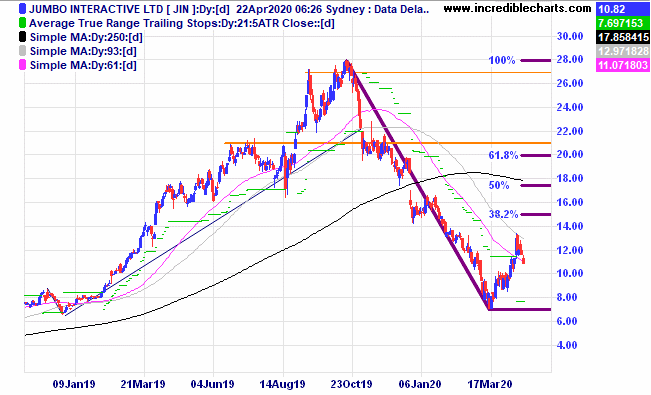
Jumbo Interactive looks to be making an interesting ABC type pattern which could offer up some possible trading opportunities. Watching.
Table
Security | Units bought (sold) | Date | Open price/ From last table | Current/close | $ gain/loss |
Buy CSL 3/12/18 at $183 c/f 9/1 at $192.31 c/fwd 3/1 at $280 | Bought 10 at $192.31 9/1/2019 | 9/1/2019 | $324.14 | $306.69 | -$174.50 |
Bought Magellan Financial Group c/fwd 3/1 at $59.00 | Bought 40 at $57.50 18/12/2019 | 18/12/2019 | $48.68 | $46.32 | -$94.40 |
Bought VTS ETF
| Bought 10 at $195.87 | 24/3/2020 | $221.10 | $221.10 | Steady |
Bought Evolution
| Bought 800 at $3.98 | 24/3/2020 | $4.94 | $4.99 | +$40.00 |
Bought Silverlake
| Bought 2,000 at $1.41 | 24/3/2020 | $1.78 | $1.81 | +$60.00 |
Bought Whitehaven Coal | Bought 1,200 at $2.00 | 31/3/2020 | $2.06 | $1.73 | -$396.00 |
Bought Invocare
| Bought 250 at $11.00 | 1/4/2020 | $11.51 | $10.00 | -$377.50 |
Bought Magellan
| Bought 30 at $50.00 | 14/4/2020 | $48.68 | $46.32 | -$70.80 |
Bought Resolute Mining | Bought 2,500 at 98c | 14/4/2020 | 96.5 | 86.5 | -$250.00 |
Bought 2 mini gold contracts
| Bought 2 at $1,748.50 | 16/4/2020 | $1,748.50 | Sold 1 at $1,761.00 Sold 1 at $1,738.00 |
+$595.00
-$555.00 |
Sold 8 ASX 200 cfd’s
| Sold 8 at 5,308 | 21/4/2020 | 5,308 | 5,221 | +$696.00 |
|
|
|
|
|
|
Start 2/1/2020 $50,000.00 | Open balance $66,131.25 |
|
|
| $66,131.25 |
Stock c/fwd 3/1 $18,427.50 | Gains/losses week -$527.20 |
|
|
| -$527.20 |
| Current total $65,604.05 |
|
|
| $65,604.05 |
Brokerage at $30 per round turn added when sold. | Less buy/ close prices and Margin $32,349.00 |
|
|
| $32,349.00 |
Prices from Tuesday’s close or 6am for US | Cash available $33,255.05 |
|
|
| $33,255.05
|
Disclaimer: The commentary and trading positions taken are for educational purposes only and are not an invitation to trade. Trading is risky and individuals should seek Professional counsel before making any financial decisions. Many thanks to Incredible Charts.com software for most of the charts used in the column.
Monitor, measure, manage and maximise… Cheers Charlie.
To order photos from this page click here


