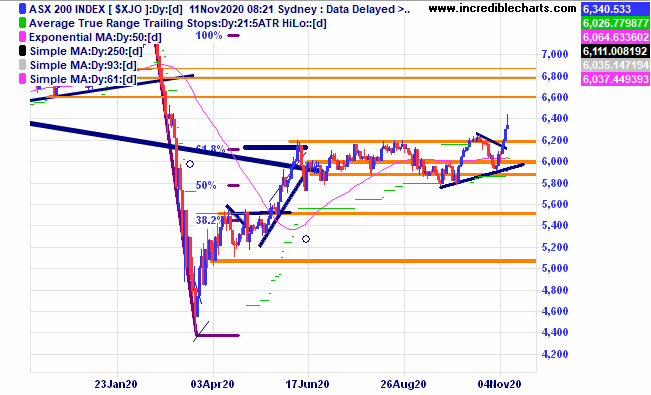
The local market is following the overseas lead from Wall Street and has put in a great couple of weeks rising around eight percent over the past eight days and breaking above the four months of sideways action.
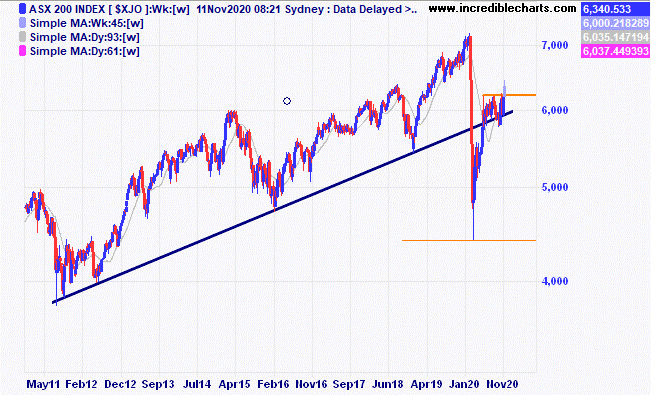
The weekly chart of the ASX 200 index showing the nice break up from a different perspective.
The asset table returns table below taken from the Vanguard website shows how at some point during the cycle Australian shares can outperform overseas shares. With Amazon and Google coming under increasing regulatory scrutiny will this reversal of trends happen again in the not too distant future? It was interesting to hear analyst Evan Lucas on ABC TV say that when the Australian market gets moving it can rack up a few gains of more than 20 per cent in a year.
| Value at | Return since | |
| Asset classes | 31 Oct 2007 | 1 Jan 2003 |
| Australian Shares | $27,671 | 23.4% p.a. |
| International Shares | $13,826 | 6.9% p.a. |
| US Shares | $11,677 | 3.3% p.a. |
| Australian Property | $22,713 | 18.5% p.a. |
| International Property | $18,042 | 13.0% p.a. |
| Australian Bonds | $12,408 | 4.6% p.a. |
| Intl. Bonds (A$ hedged) | $13,483 | 6.4% p.a. |
| Cash | $13,104 | 5.8% p.a. |
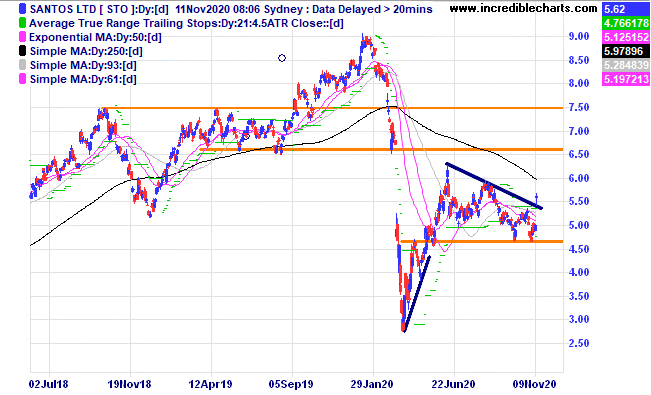
The energy sector has been very robust the past couple of days. Santos moved up out of congestion on the daily chart and turned the trailing ATR around. We bought a parcel today for the educational portfolio.
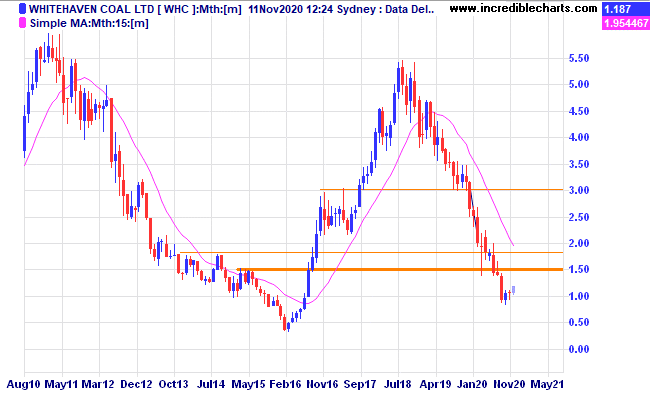
Is the weekly “rollercoaster” about to swing up for Whitehaven Coal.
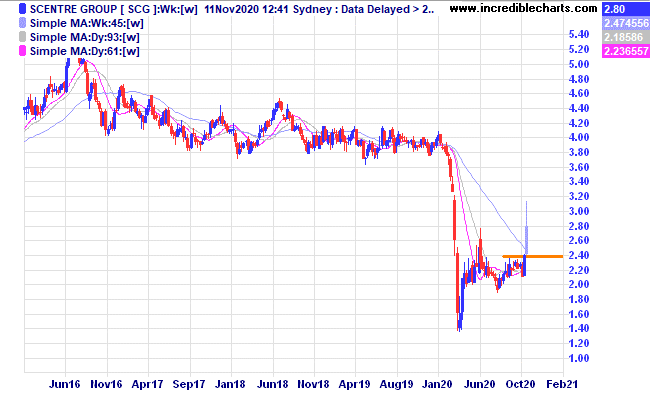
Only last week Jun Bei Liu said on a COB podcast that Scentre Group would double over the next year. Looks like it is off to a good start.
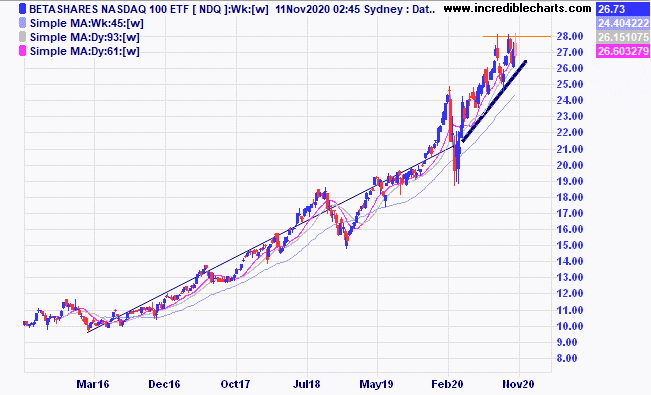
The Nasdaq index ETF is having trouble moving above the $28 level for now.
Travel and tourism stocks including Ardent Leisure took off over the past few days giving the educational portfolio a nice little boost, woo hoo.

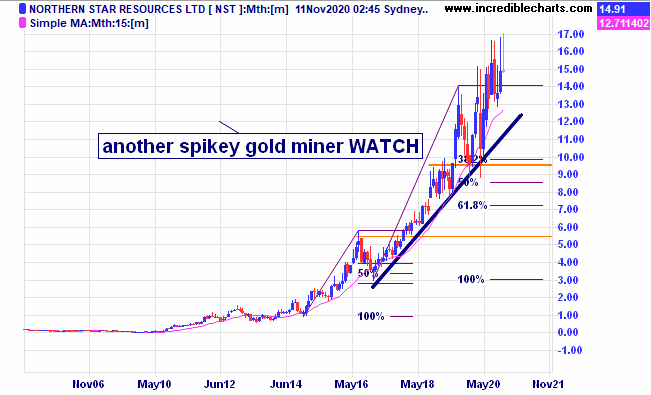
The gold sector took a hit yesterday and a few stocks look to be struggling to move past stubborn resistance zones including Northern Star and Evolution.
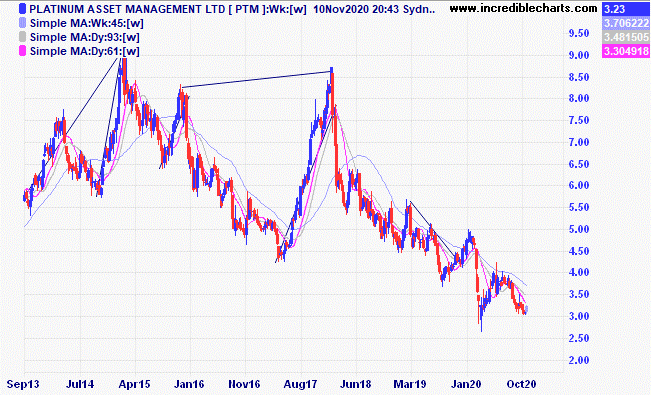
Platinum Asset Management is still struggling and the prospect of a working vaccine could help.
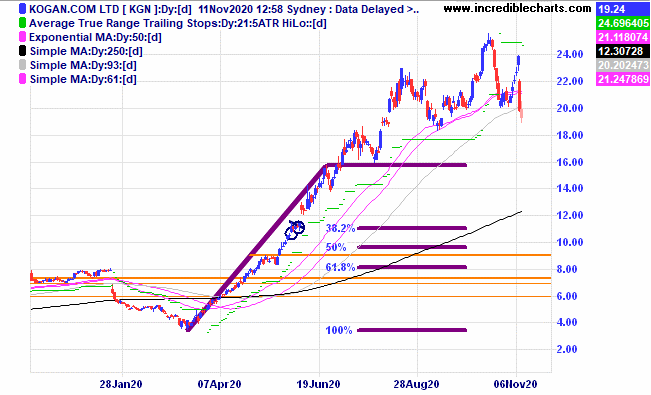
Online retailer Kogan fell 17 per cent yesterday as it looked like investors were rotating out of recently popular “Tech” type stocks for travel and energy related companies.
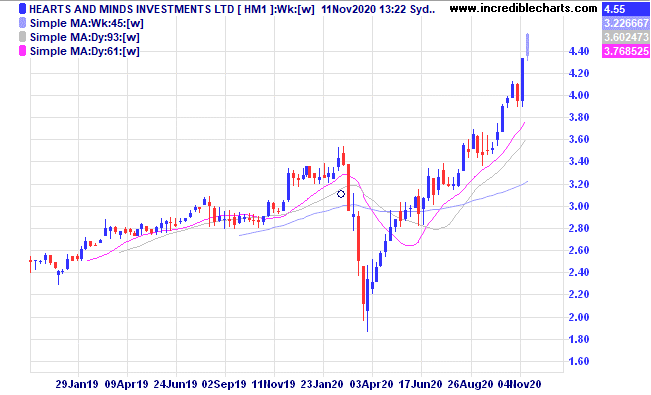
Hearts and Minds Investments has returned more than 30 per cent in each of the past two years. We will add some to the educational portfolio to replace Magellan as the core longer term fund.
Table
Security | Units bought (sold) | Date | Open price/ From last table | Current/close | $ gain/loss |
Buy CSL 3/12/18 at $183 c/f 9/1 at $192.31 c/fwd 3/1 at $280 | Bought 10 at $192.31 9/1/2019 | 9/1/2019 | $291.97 | $304.60 | +$126.30 |
Bought Magellan Financial Group c/fwd 3/1 at $59.00 | Bought 40 at $57.50 18/12/2019 | 18/12/2019 | $57.14 | $60.51 | +$134.80 |
Bought Evolution
| Bought 400 at $3.98 | 24/3/2020 | $5.83 | $5.78 | -$20.00 |
Bought Silverlake
| Bought 1,500 at $1.41 | 24/3/2020 | $2.17 | $2.03 | -$210.00 |
Bought Nickel Mines
| Bought 4,500 at 52.5c | 29/4/2020 | 84 | 87.5c | +$157.50
|
Bought Stavely
| Bought 4,000 at 56c | 11/6/2020 | 79.5 | 91 | +$460.00 |
Bought Ardent Leisure | Bought 3,000 at 40c | 1/7/2020 | 65.5 | 81 | +$465.00 |
Bought Ardent Leisure | Bought 1,500 at 35c | 6/8/2020 | 65.5 | 81 | +$232.50 |
Bought Pro Medicus
| Bought 100 at $25.30 | 19/8/2020 | $32.75 | $32.78 | +$3.00 |
Bought Costa Group
| Bought 700 at $3.65 | 2/9/2020 | $3.56 | $3.69 | +$91.00 |
Bought Ooh Media
| Bought 2,500 at $1.13 | 28/9/2020 | $1.30 | $1.59 | +$725.00 |
Bought Whitehaven Coal | Bought 3,000 at $1.05 | 28/9/2020 | $1.07 | $1.12 | +$150.00 |
Bought NDQ ETF
| Bought 150 at $26.50 | 1/10/2020 | $26.10 | $26.73 | +$94.50 |
Bought Resimac
| Bought 2,000 at $1.45 | 2/10/2020 | $1.36 | $1.58 | +$440.00 |
Bought Carsales
| Bought 130 at $22.15 | 8/10/2020 | $20.88 | $21.33 | +$58.50 |
Bought Bapcor
| Bought 400 at $7.61 | 9/10/2020 | $7.71 | $7.40 | -$93.00 |
Bought Goodman Group | Bought 150 at $19.10 | 14/10/2020 | $18.69 | $18.30 | -$43.50 |
Bought Baby Bunting | Bought 700 at $4.40 | 4/11/2020 | $4.40 | $4.49 | +$63.00 |
Bought Webjet
| Bought 800 at $3.90 | 4/11/2020 | $3.90 | $4.86 | +$768.00 |
|
|
|
|
|
|
Start 2/1/2020 $50,000.00 | Open balance $73,900.15 |
|
|
| $73,900.15 |
Stock c/fwd 3/1 $18,427.50 | Gains/losses week +$3,602.60 |
|
|
| +$3,602.60 |
| Current total $77,502.75 |
|
|
| $77,502.75 |
Brokerage at $30 per round turn added when sold. | Less buy/ close prices and Margin $58,230.90 |
|
|
| $58,230.90 |
Prices from Tuesday’s close or 6am for US | Cash available $19,271.85 |
|
|
| $19,271.85
|
Disclaimer: The commentary and trading positions taken are for educational purposes only and are not an invitation to trade. Trading is risky and individuals should seek Professional counsel before making any financial decisions. Many thanks to Incredible Charts.com software for most of the charts used in the column.
Monitor, measure, manage and maximise… Cheers Charlie.
To order photos from this page click here


