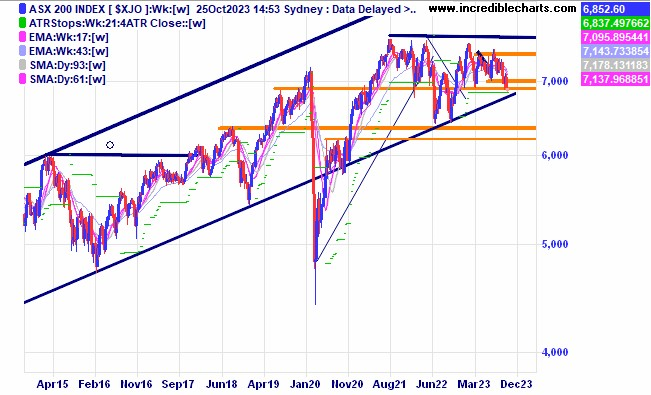
The local market recently made another lower low.
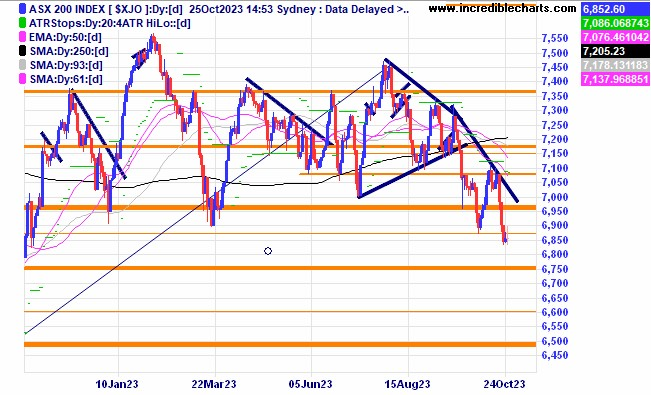 The longer-term view of the local market shows prices still within the longer term trend channel upwards.
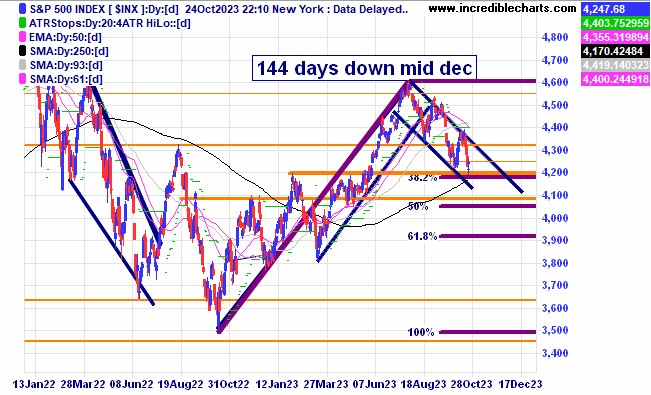
The US S@P 500 index made what could become an interesting pivot point off an area of support.
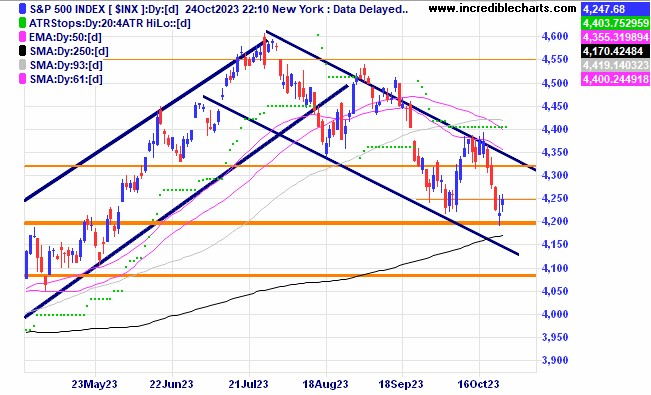 On a longer term view the S@P 500 has been trending nicely in channels. After moving up for 288 days the 144 or half the range up ends December 18th. The Fibonacci retracement levels are also shown.
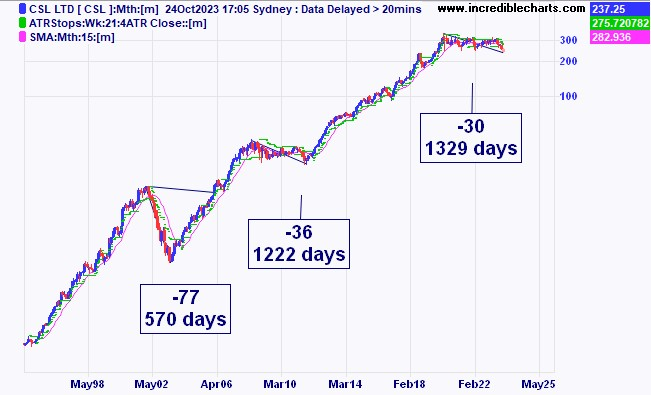
A chart of CSL showing previous downturns in number of days down and percentage retracements. The 15month moving average shows a clue to the beginning of the next leg up.
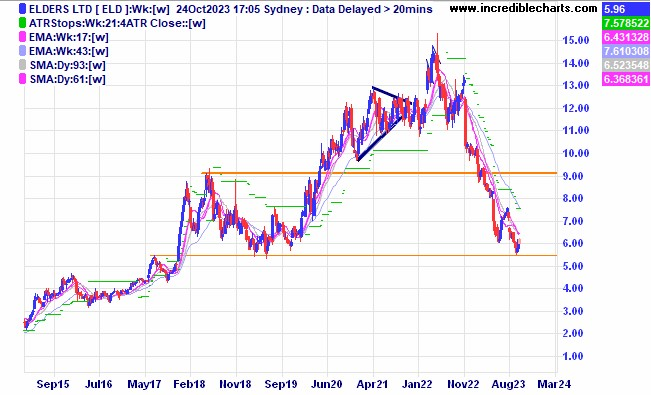
Elders price is down to a possible area of support.
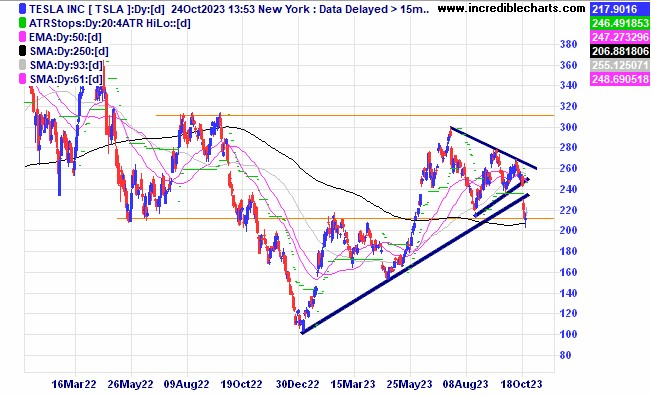
The Tesla price has broken down out of a consolidation pattern and looks to have found some support at this level.
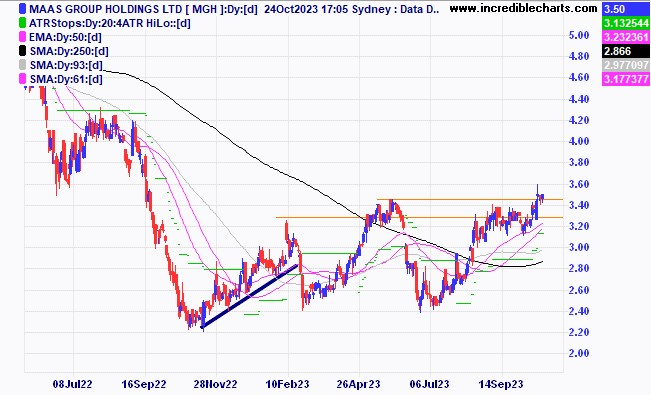
MAAS Group holdings recently made a new 52 week high. In today’s Financial Review there were 6 new 52 week highs and 79 52 week lows.
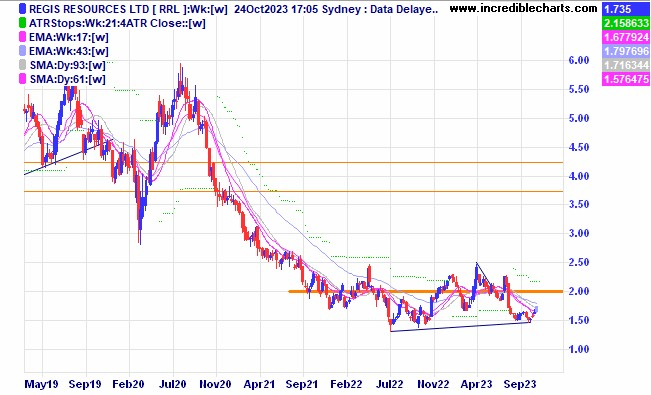
Regis Resources could be forming a nice base for a decent move upwards.
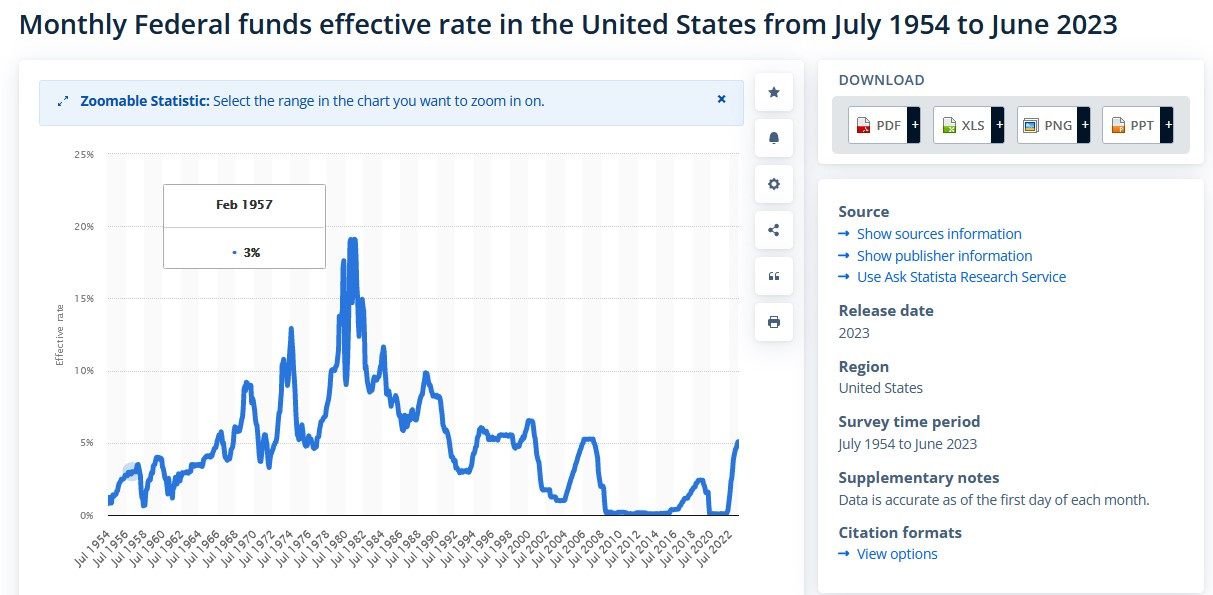
An interesting graph of US interest rates over the past 60 odd years.
Disclaimer: The commentary on different charts is for general information purposes only and is not an invitation to trade. Trading is risky and individuals should seek Professional counsel before making any financial decisions. Many thanks to Incredible Charts.com software for most of the charts used in the column.
Monitor, measure, manage and maximise… Cheers Charlie.
To order photos from this page click here


