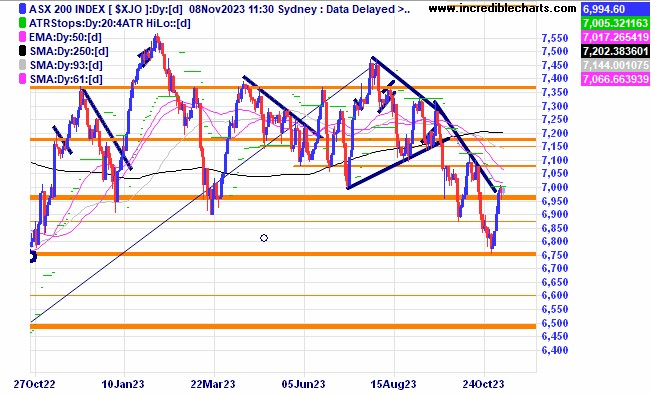
The local market looks to have stalled around the current support/resistance zone for now.
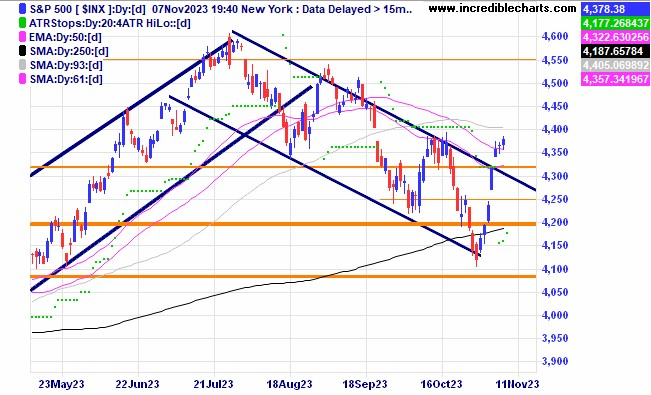
The US S@P 500 index has now spent three days above the down trend channel with some price resistance ahead of it as we move further into the strong year end seasonal pattern.
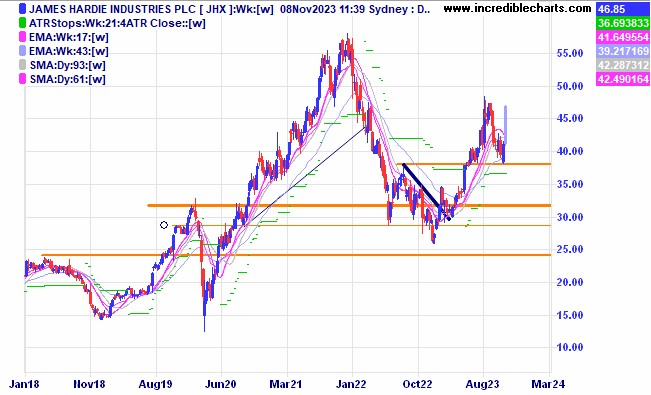
James Hardie jumped more than ten per cent in morning trade on the back of the latest set of numbers.
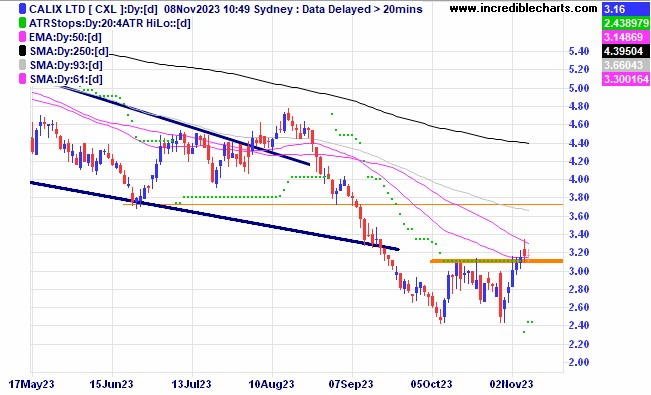
Calix looks to have formed a W type bottoming pattern.
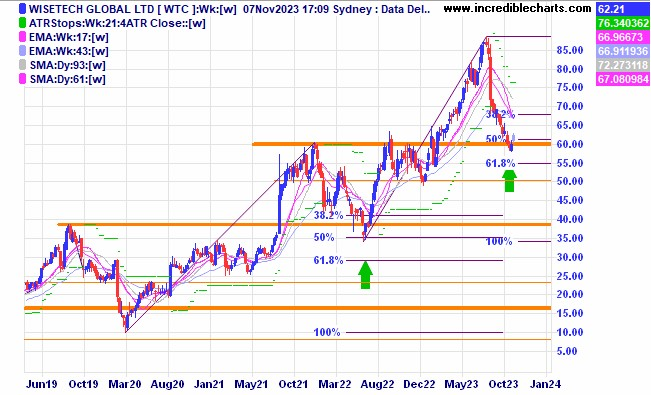
Wisetech Global looks to be making a nice bounce off a support level on the weekly chart.
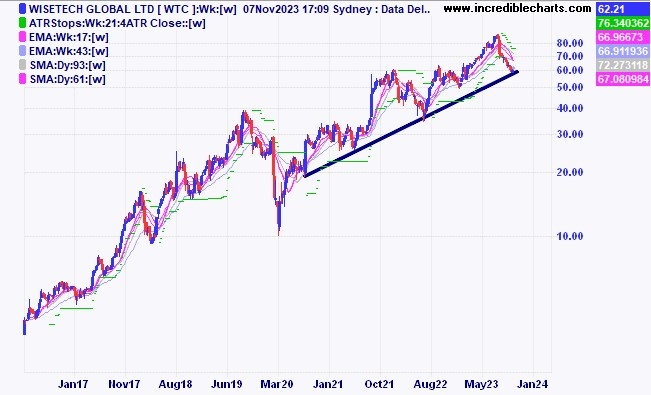
Wisetech Global on a weekly log chart has again bounced off the current uptrend line.
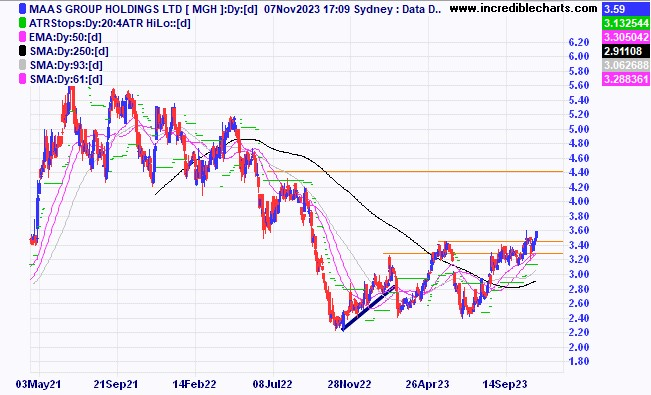
Maas Group is slowly moving above the resistance zone.
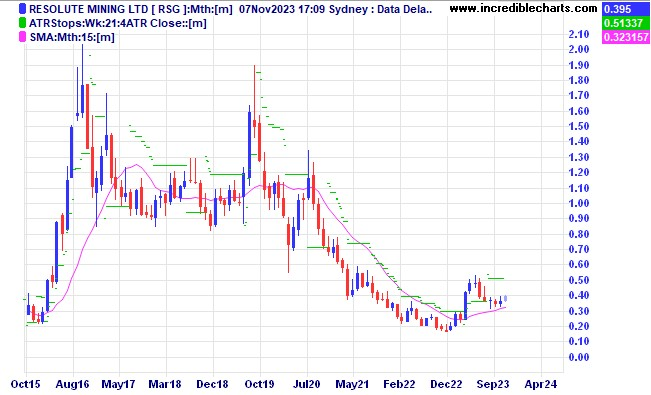
Resolute Mining looks to be forming a possible ABC pattern off the recent low on a monthly chart.
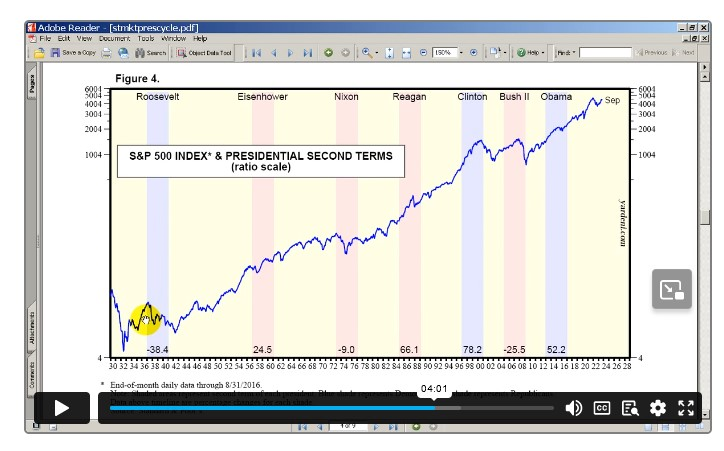
The period just before the coloured lines on this chart show the year coming up to the second term election for an incumbent president. Going on past history 2024 could be a positive year for the US share market.
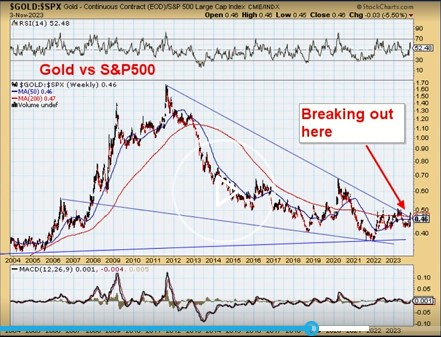
The gold price looks likely to outperform the S@P 500 index over the medium term if the current break out continues.
Disclaimer: The commentary on different charts is for general information purposes only and is not an invitation to trade. Trading is risky and individuals should seek Professional counsel before making any financial decisions. Many thanks to Incredible Charts.com software for most of the charts used in the column.
Monitor, measure, manage and maximise… Cheers Charlie.
To order photos from this page click here


