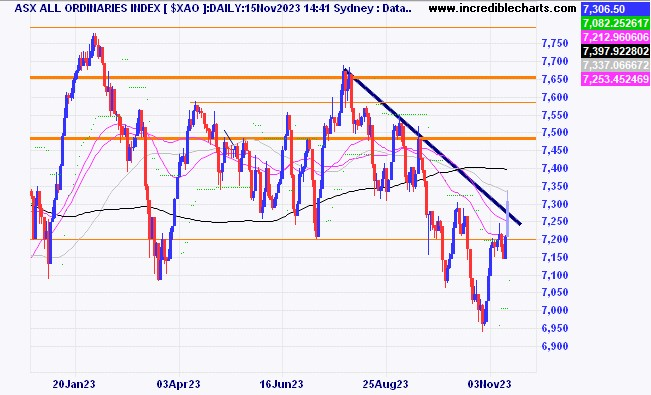
The local market just poked above the down trend line on the All Ordinaries index today for the first time since the July peak after gaining around 1.4 per cent. A higher low is also a sign of strength coming back into the market.
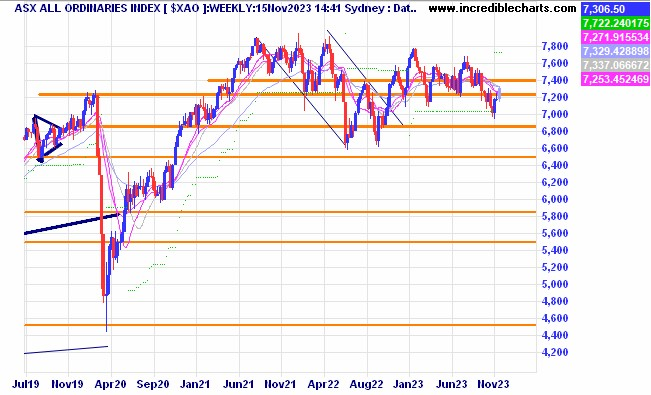
The All Ords on a weekly time frame shows the protracted sideways malaise might continue for a while yet.
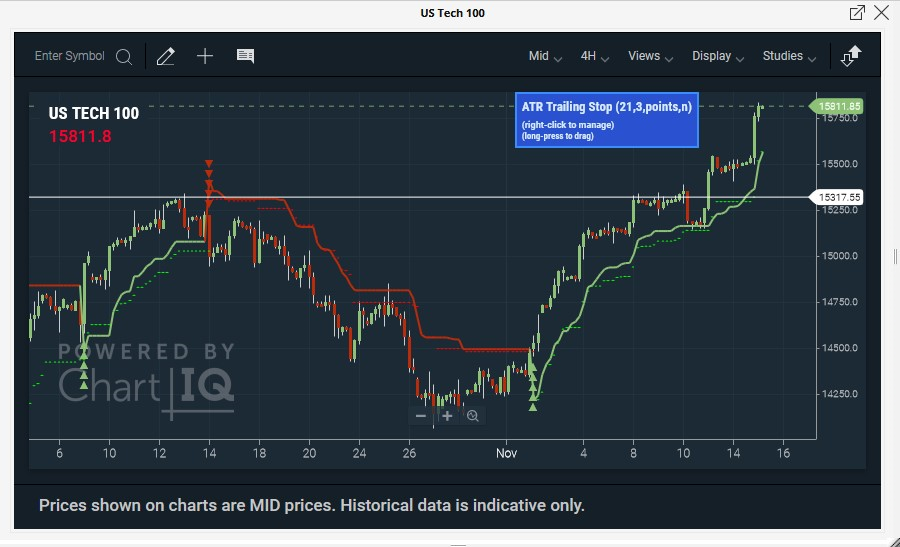
The US based Nasdaq 100 index shows a potential cup and handle pattern on the four-hour chart dipping down to the ATR trailing stop, recovering and then drifting before the CPI data release then belting upwards. The pattern gives an end target of around 16,350 points.
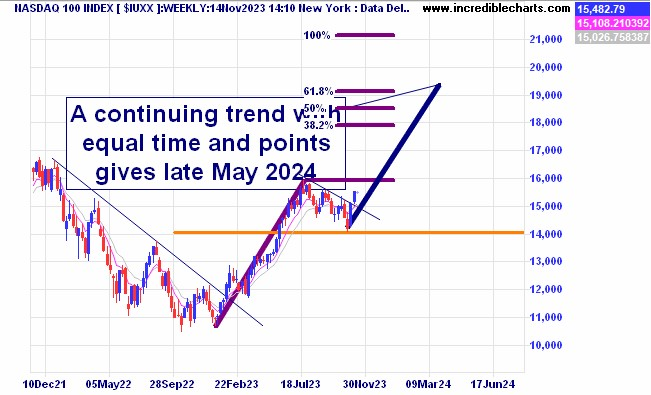
The US based Nasdaq Index on a weekly timeframe shows where the index might go over the next six months or so according to a small handful of more optimistic analysts.
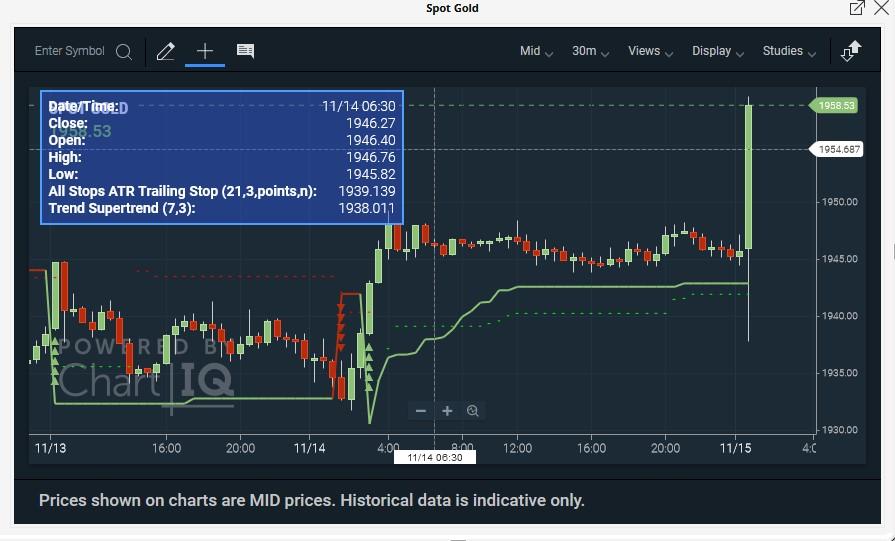
 This chart shows the price of gold on a 30-minute chart encompassing the volatile time before and after last night’s US Consumer Price Index update.
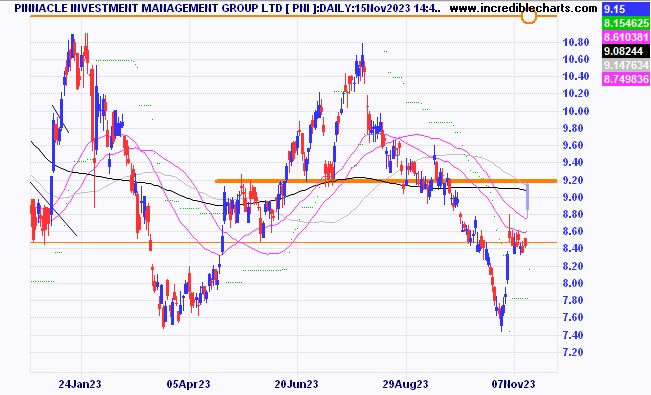
Funds management outfit Pinnacle was one of the top performers today after US inflation figures came in below expectations.
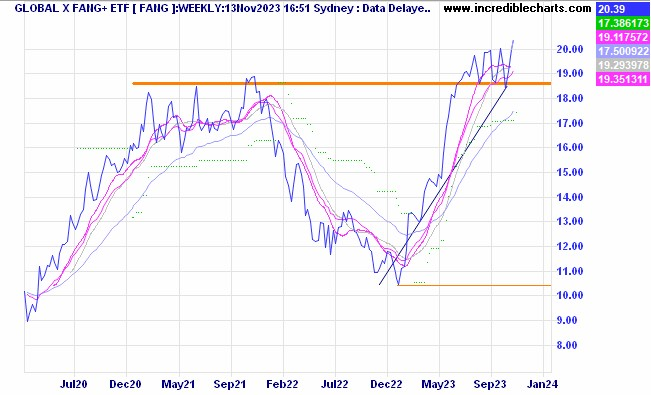
The ASX listed FANG ETF could get a boost today after a two per cent rise in US markets overnight. The stronger Australian dollar could take some shine off that boost.
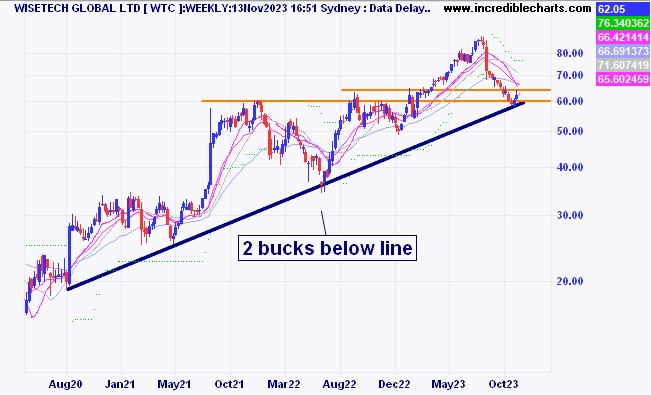
This chart for Wisetech shows the bounce off the trendline which has so far been increasing at around 40 per cent per year from the August 2020 low. Investors are wondering how long that might keep going? Only the passing of time will tell.
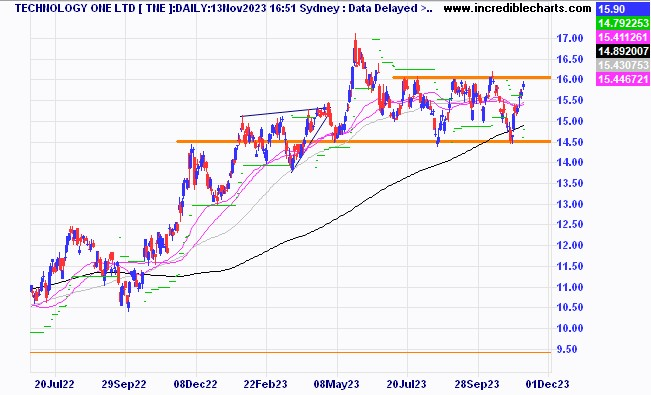
Technology One has been stuck in a sideways range for a while.
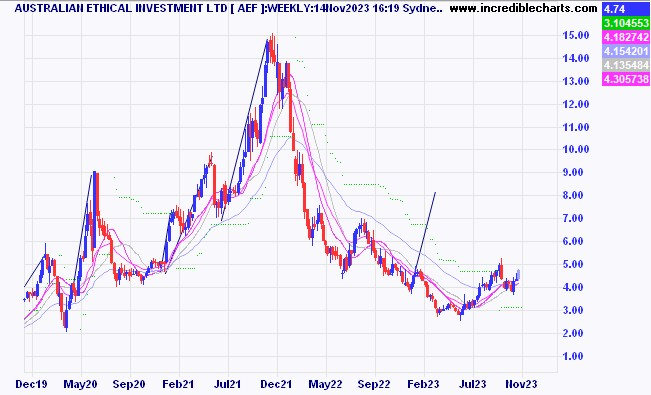
The chart of Australian Ethical Investment is forming a nice little ABC pattern on the weekly timeframe.
The Nanosonics chart looks interesting.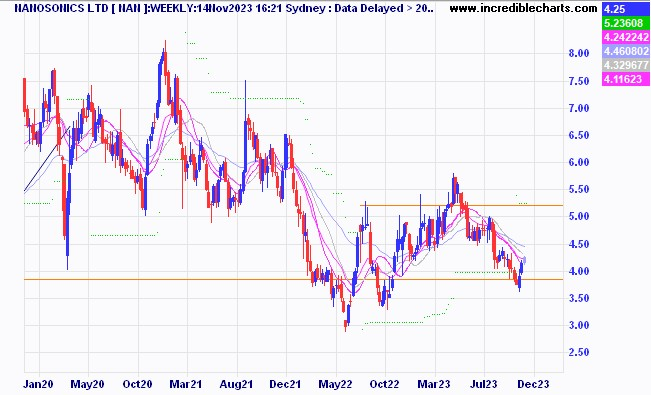
Australian household income is declining faster than that of the average OECD nation.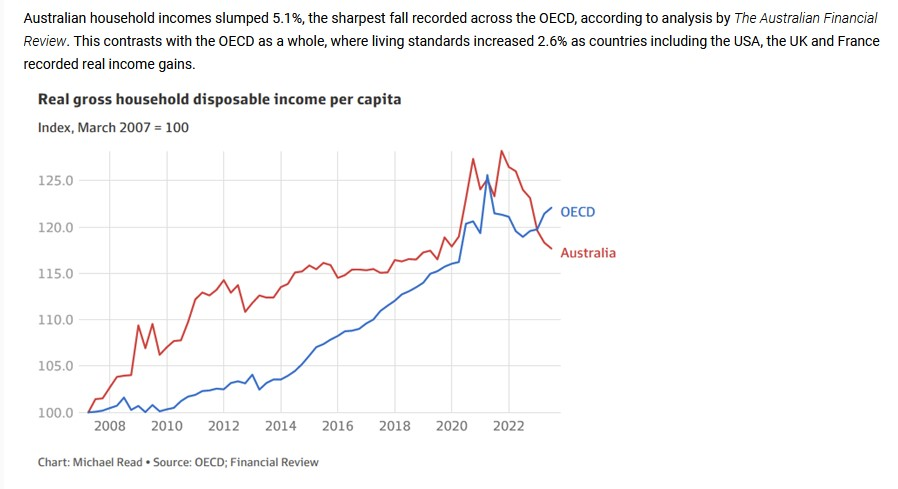
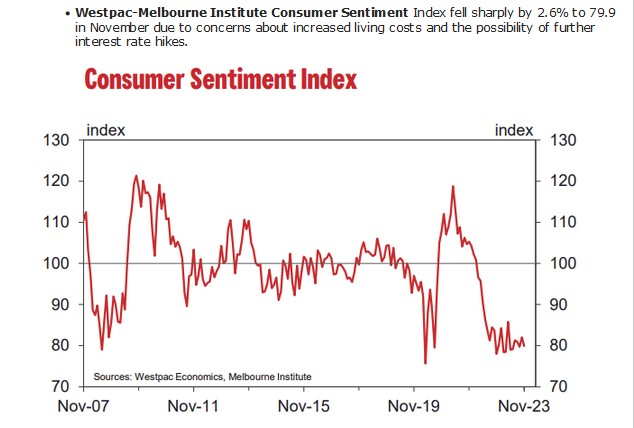
The Westpac Consumer Sentiment Index is still at very low levels.
Disclaimer: The commentary on different charts is for general information purposes only and is not an invitation to trade. Trading is risky and individuals should seek Professional counsel before making any financial decisions. Many thanks to Incredible Charts.com software for most of the charts used in the column.
Monitor, measure, manage and maximise… Cheers Charlie.
To order photos from this page click here


