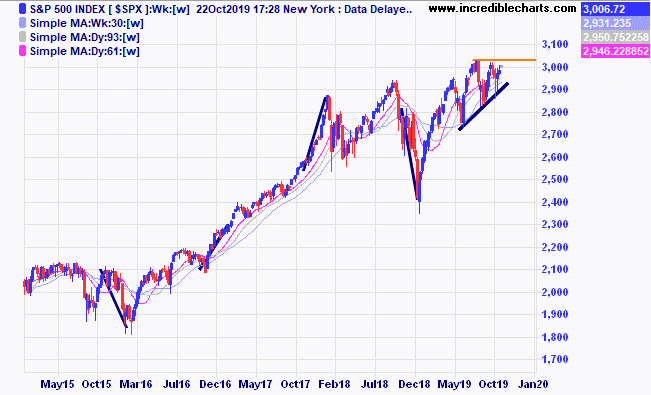
The US S@P 500 index is at an interesting place as we head into the traditional “Best 6 months” strategy. The weekly chart of the S@P500 shows that price could be on the cusp of a break upwards out of the current sideways pattern after a number of higher lows.
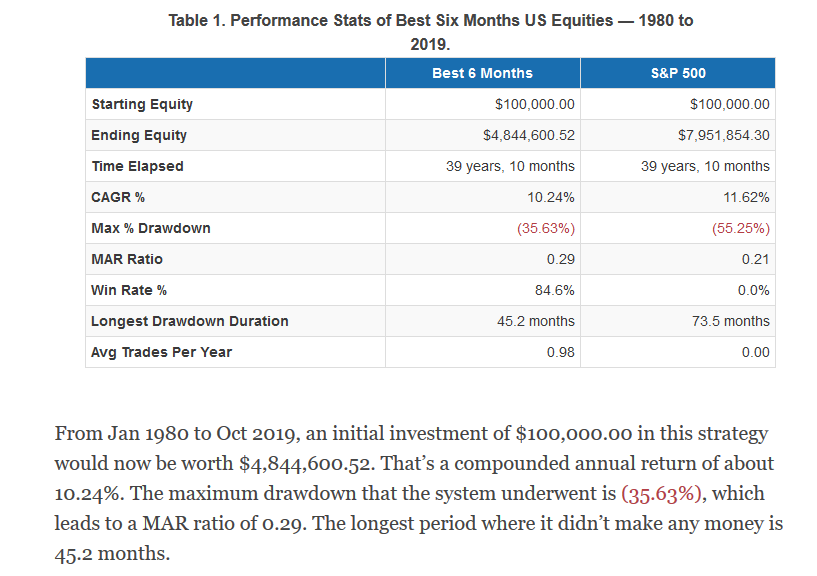
Some basic statistics from the “Best 6 months” strategy show it is a time for a generally rising market over this period. How best to take advantage of that seasonal tendency depends on the trader, be it individual stocks, ETF,s or geared derivatives.
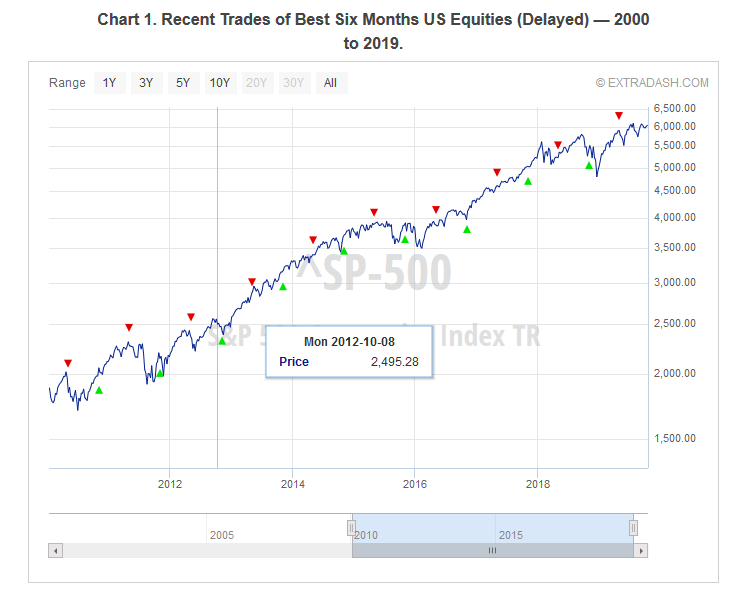
A chart showing the last few years entries on November 1st and exits on 1st May and despite a dip last year still came out in front.
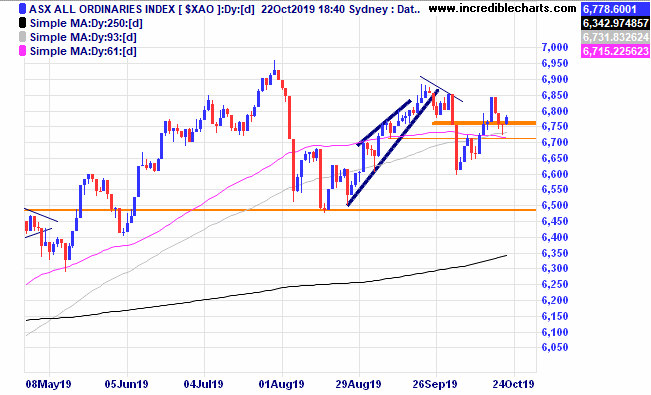
The local market is still stuck in a sideways move as some traders look for a suitable entry point for a possible year-end rally. Perhaps an ABC type pattern with a well placed stop.
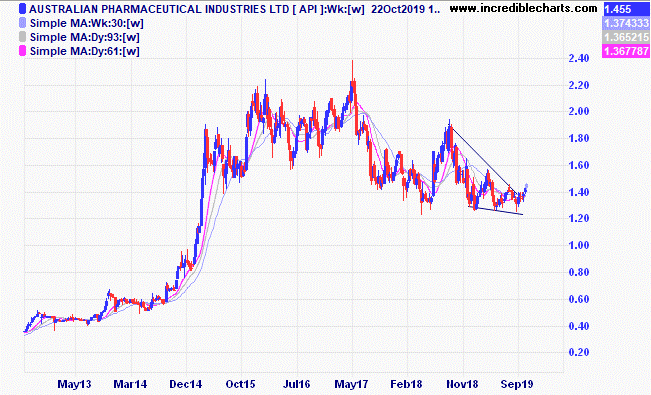
Australian Pharmaceutical looks to be in the early stages of a move up and we will add some to the educational portfolio today. Mayne Pharma shows a similar pattern.
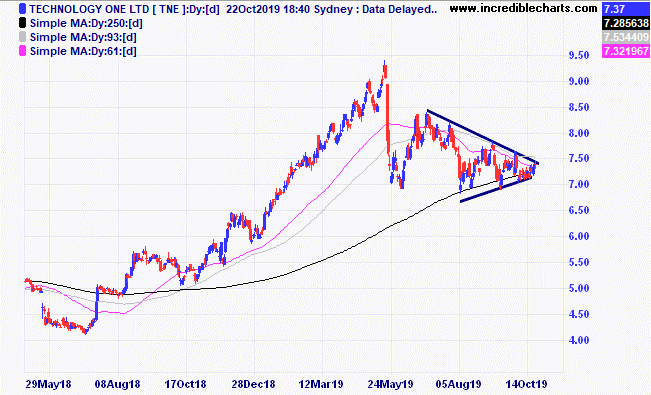
Technology One looks poised for a break out after forming a nice-looking consolidation pattern and is one we are watching.
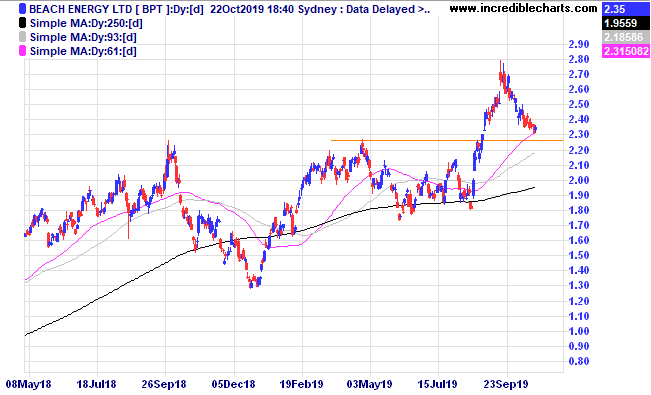
Beach Energy has nearly retraced to the previous highs.
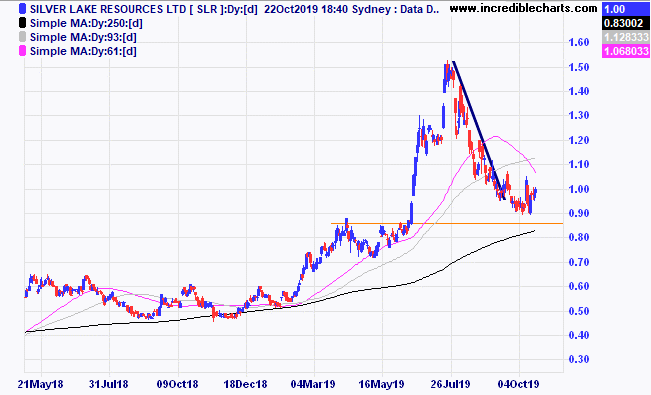
Silver Lake Resources looks to have found support at current levels with the sniff of a potential trade in the air.
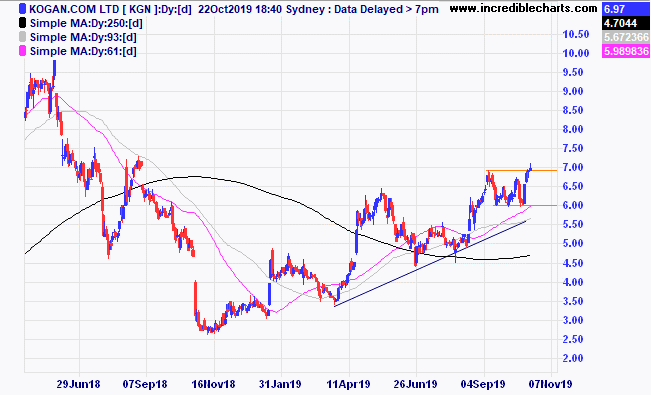
Kogan has again reached the top of the sideways range, will it go on from here. We will sell half our position today and will look to add more should price retreat to thee lows.
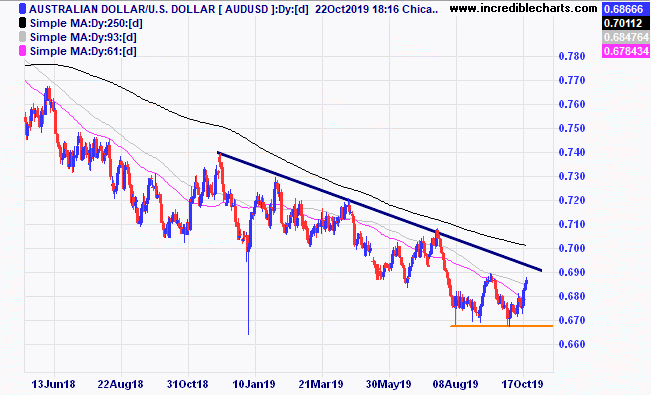
After a long run down could the Australian dollar be forming a base pattern?
Table
Security | Units bought (sold) | Date | Open price/ From last table | Current/close | $ gain/loss |
Bought CSL 3/12/18 $183 c/f 9/1 at $192.31 | Bought 15 at $192.31 | 9/1/2019 | $248.39 | $250.75 | +$35.40 |
Bought Westgold
| Bought 1,500 at $1.03 | 7/2/2019 | $2.14 | Sold 500 16/10 at $2.10 1,000 left at $2.01 | -$50.00
-$130.00 |
Bought Cooper Energy | Bought 5,000 at 53 | 18/4/2018 | 57.5c | 56.5c | -$50.00 |
Bought Evolution
| Bought 600 at $3.25 | 9/5/2019 | $4.40 | Sold 16/10 at $4.20 | -$150.00
|
Bought Qube
| Bought 1,000 at $3.04 | 26/6/2019 | $3.35 | $3.25 | -$100.00 |
Bought Ecofibre | Bought 1,000 at $2.80 | 18/7/2019 | $3.35 | $3.29 | -$60.00 |
Bought Western Areas | Bought 800 at $2.26 | 8/8/2019 | $3.07 | $3.12
| +$40.00 |
Bought IPH
| Bought 400 at $8.55 | 19/8/2019 | $8.17 | $8.00 | -$68.00 |
Bought Capitol Health | Bought 10,000 at 24c | 28/8/2019 | 23c | 24.5 c | +$150.00 |
Bought NextDC
| Bought 400 at $6.55 | 28/8/2019 | $6.41 | $6.34 | -$28.00 |
Bought Reliance Worldwide | Bought 800 at $3.70 | 28/8/2019 | $4.09 | $4.25 | +$128.00 |
Bought Eclipse
| Bought 1,500 at $1.55 | 4/9/2019 | $1.55 | $1.67 | +$180.00 |
Bought Lifestyle Communities | Bought 300 at $7.20 | 4/9/2019 | $7.59 | $7.95 | +$108.00 |
Bought Whitehaven Coal | Bought 800 at $3.50 | 11/9/2019 | $3.18 | $3.28 | +$80.00 |
Bought Santos
| Bought 350 at $7.80 | 16/9/2019 | $7.69 | $7.77 | +$28.00 |
Bought Kogan
| Bought 500 at $6.25 | 25/9/2019 | $6.04 | $6.97 | +$465.00 |
Bought Money3
| Bought 1,200 at $2.25 | 25/9/2019 | $2.18 | $2.22 | +$48.00 |
Bought Wagners | Bought 1,500 at $1.75 | 16/10/2019 | $1.75 | $1.81 | +$90.00 |
|
|
|
|
|
|
|
| Start 7/1/19 $50,000.00 | Open balance $70,532.95 |
| $70,532.95 |
|
|
| Gains/losses week +$716.40 |
| +$716.40 |
|
|
| Current total $71,249.35 |
| $71,249.35 |
Brokerage at $30 per round turn added when sold. |
|
| Less purchase, close prices/FX/ Margins $48,833.25 |
| $48,833.25 |
Prices from Tuesday’s close or 6am for US |
|
| Cash available $21,416.10 |
| $22,416.10
|
Disclaimer: The commentary and trading positions taken are for educational purposes only and are not an invitation to trade. Trading is risky and individuals should seek Professional counsel before making any financial decisions. Many thanks to Incredible Charts.com software for most of the charts used in the column.
Monitor, measure, manage and maximise… Cheers Charlie.
To order photos from this page click here


