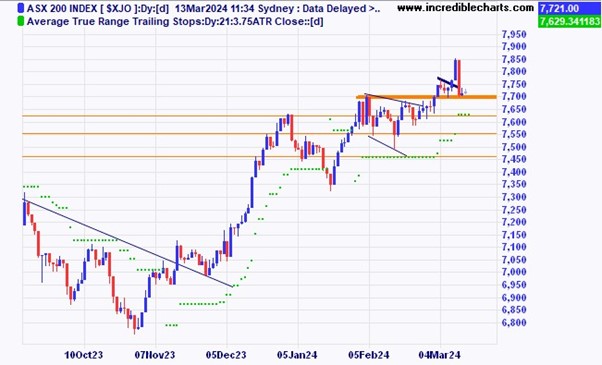
The local market is down from the highs after following the US market lower and could be forming a bearish flag pattern or on the other hand is perhaps consolidating near support for a further move higher. Time will tell.
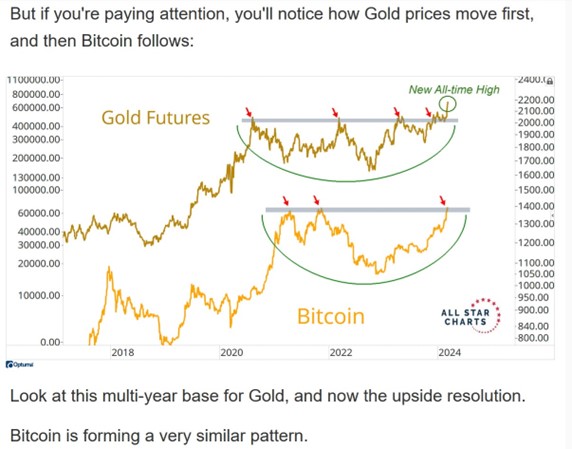
The prices of gold and bitcoin look to be following similar trajectories.
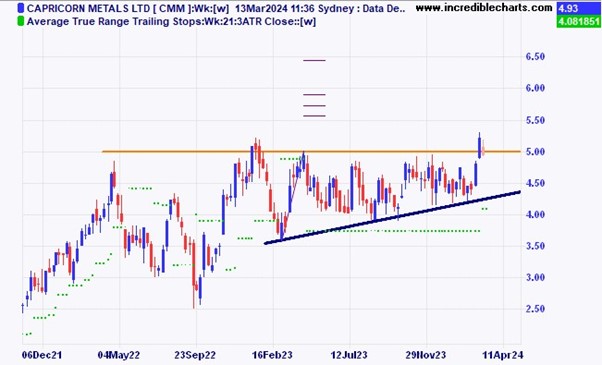
Gold stocks like Capricorn Metals are down from the highs as gold fell after the latest CPI figures from the US.
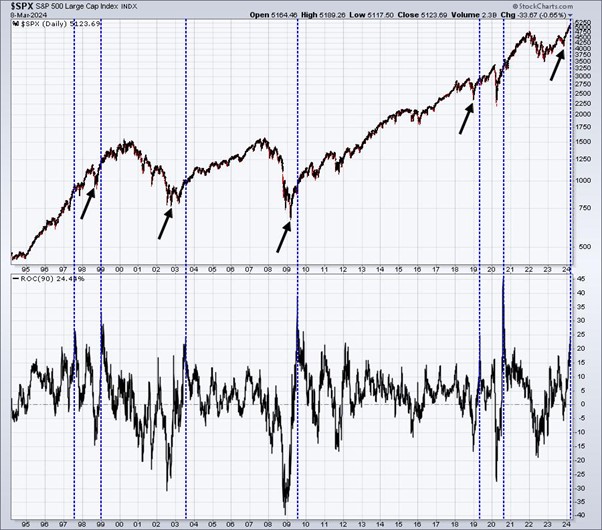
The following is from Tom Bowley at Stock charts and shows that fast rallies of 25 per cent in 90 days usually happen just after a decent low and can come before the start of a longer-term rally.
Tom says, But huge rallies do not always end in despair. In fact, most just keep on truckin’!
Let’s check to see how the rally off the October 27th low measures up against other periods over the past few decades, first on the S&P 500 and then on the semiconductors index ($DJUSSC):
S&P 500:
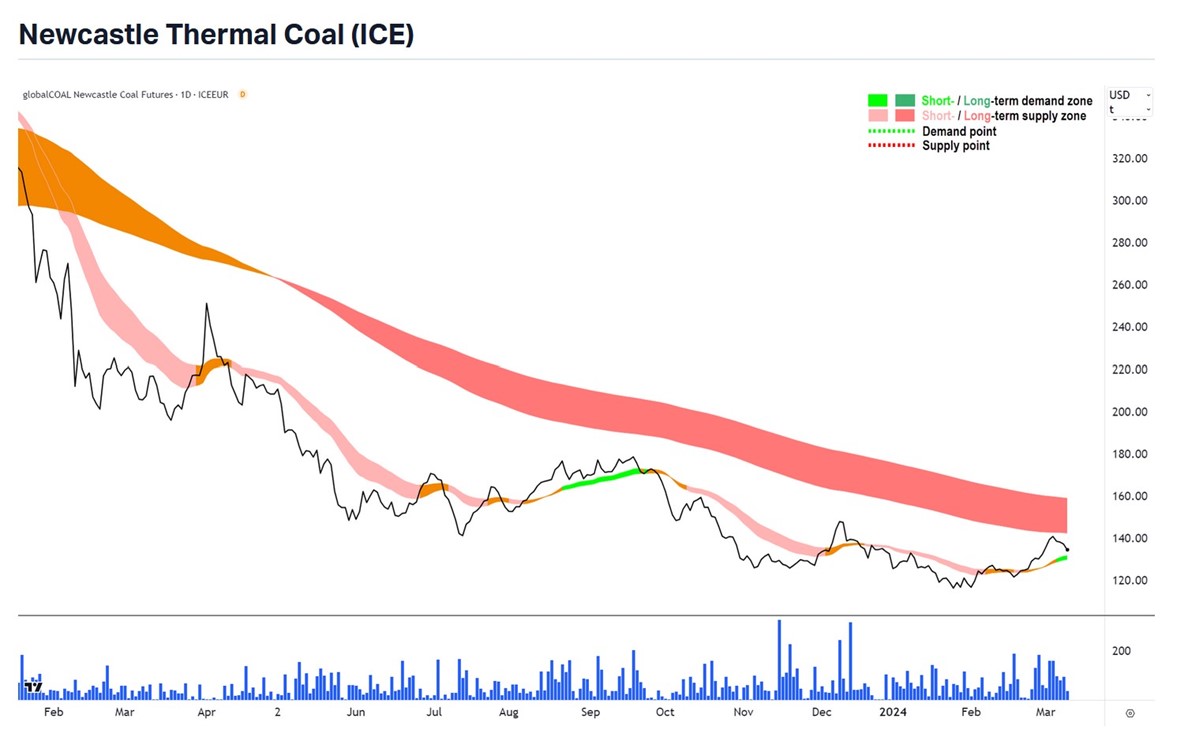
The price of thermal coal has been on the slide for some time, chart from Market Index.
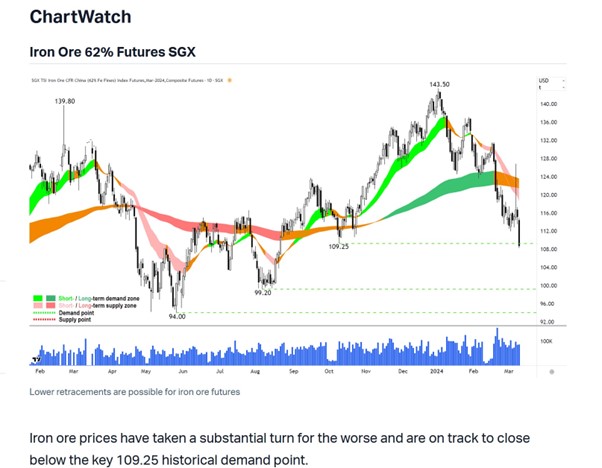
The price of iron ore is also on the decline, chart from Market Index.
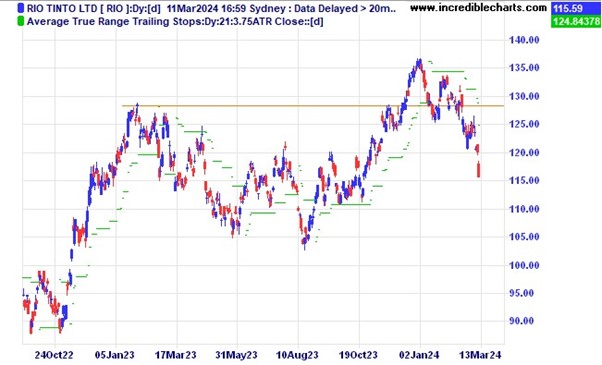
Rio has come off the highs as the price of iron ore moves lower.
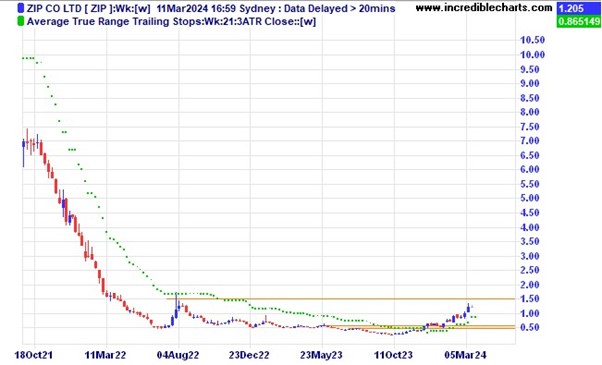
Is Zip forming a rounding bottom type pattern?
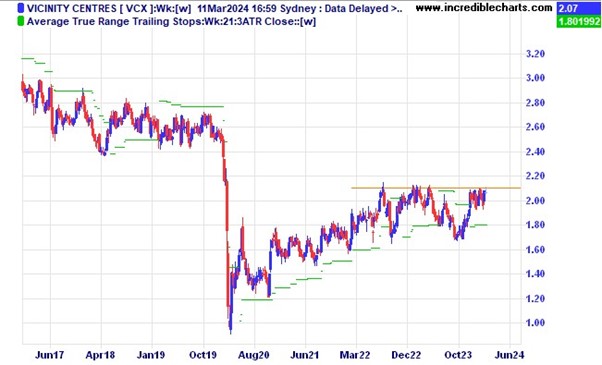
Vicinity Centres looks to be building for a move higher.
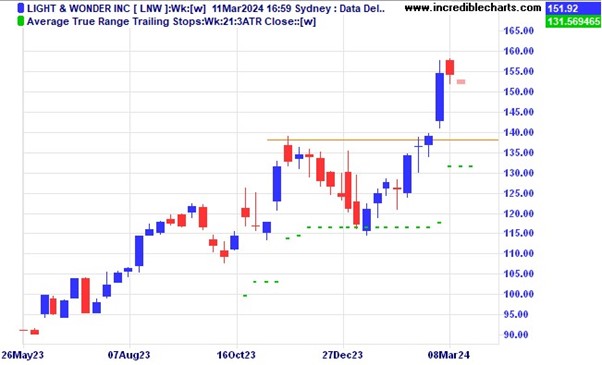
Is Light and Wonder forming a bullish flag pattern?
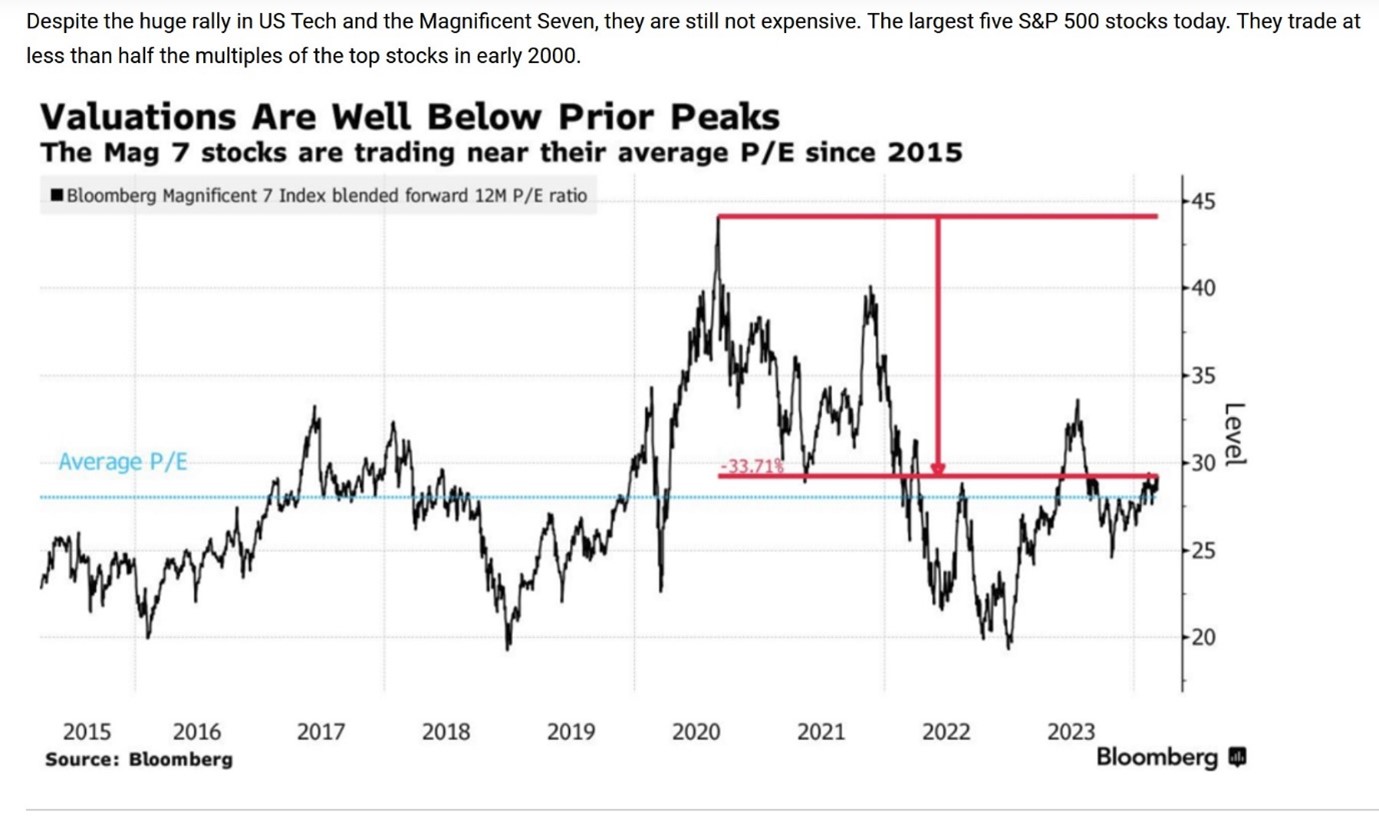
Some analysts reckon those big stocks in the US are a long way from being overvalued compared to prior peaks.
Disclaimer: The commentary on different charts is for general information purposes only and is not an invitation to trade. Trading is risky and individuals should seek Professional counsel before making any financial decisions. Many thanks to Incredible Charts.com software for most of the charts used in the column.
Monitor, measure, manage and maximise… Cheers Charlie.
To order photos from this page click here


