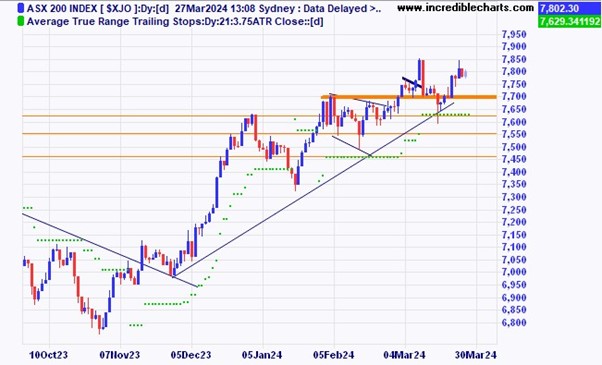
The local market is trading sideways in a tight range before important economic news releases later this week.
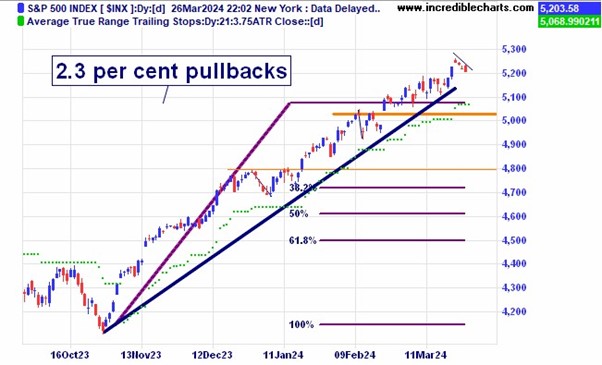
The US S@P 500 index is rising at the rate of around 75 per cent per year and so far has had only minor pullbacks of less than 2.5 per cent. How much further can it go?
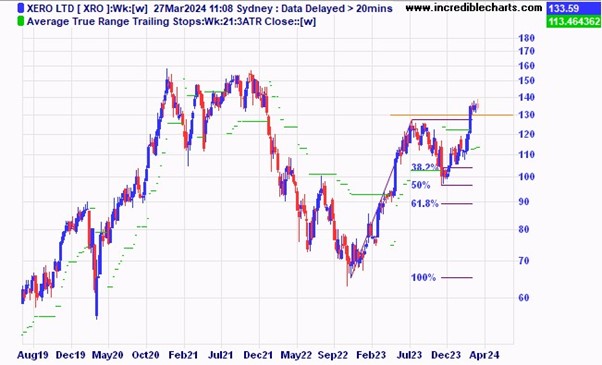
Local Technology stocks Xero and Wistech Global have similarly tight consolidation patterns. Which way from here?
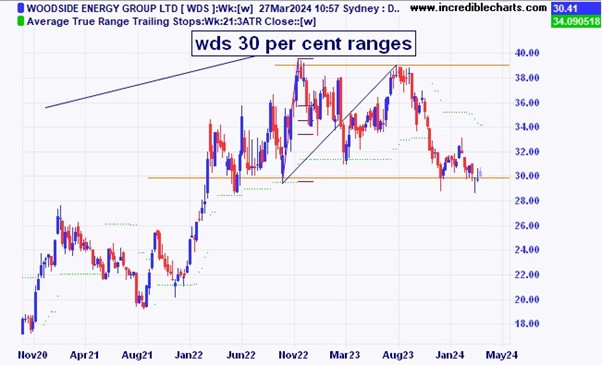
Energy stock Woodside is down near the lows of a large sideways range.
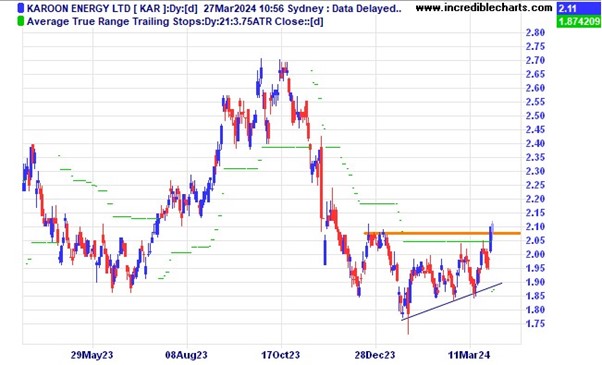
Karoon Energy looks to be moving out of a basing pattern.
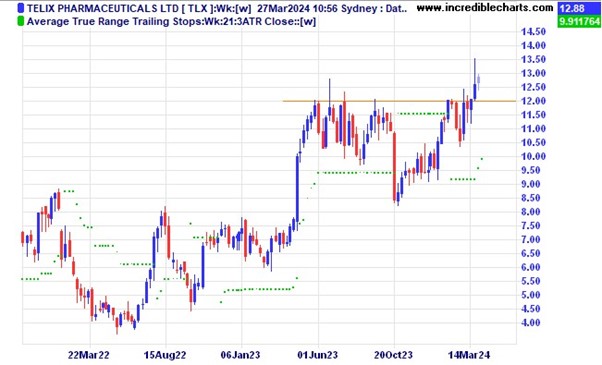
Telix recently made a fresh high. Will the weekly spike in prices see a temporary top in place?
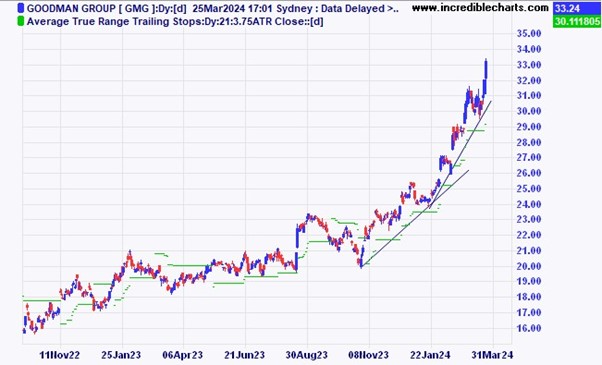
Goodman Group is accelerating the recent rise and is starting to look a little bit parabolic in nature.
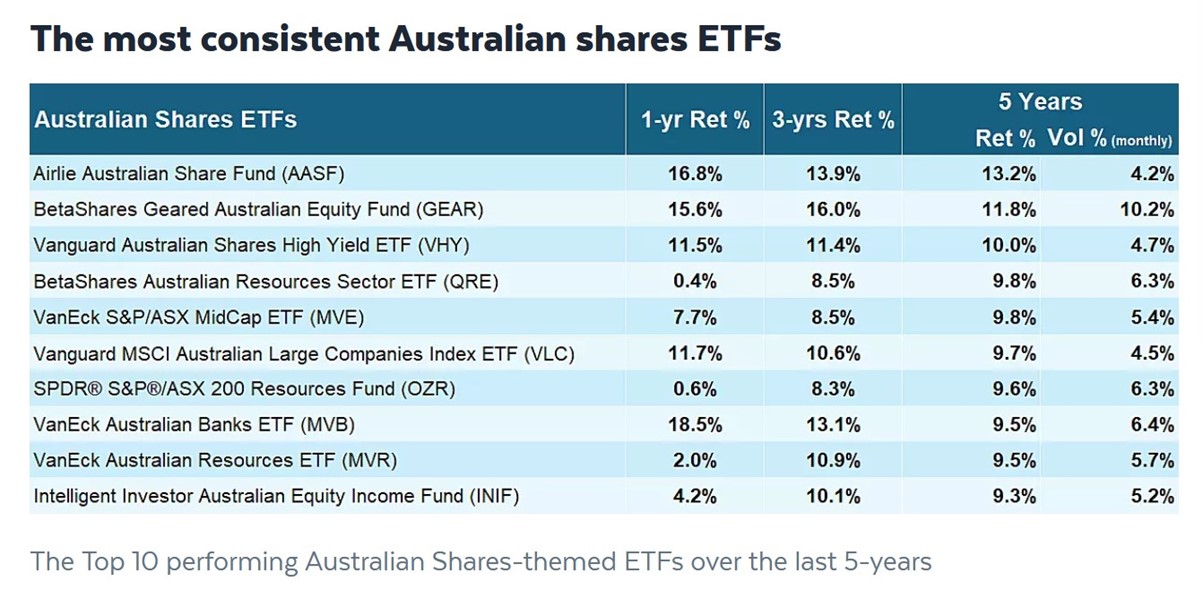
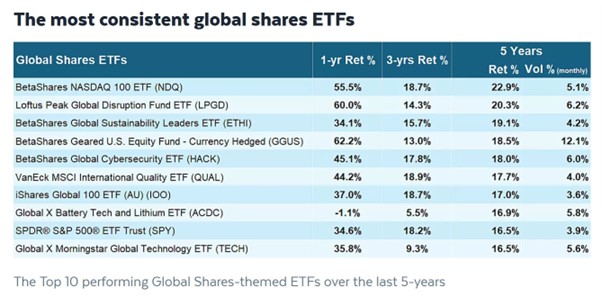
Some interesting figures on the best performing Australian market ETF’s from Market Index.
A table of the most consistent Australian listed overseas stock ETF’s showing some outperformance compared to the Australian stock ETF’s.
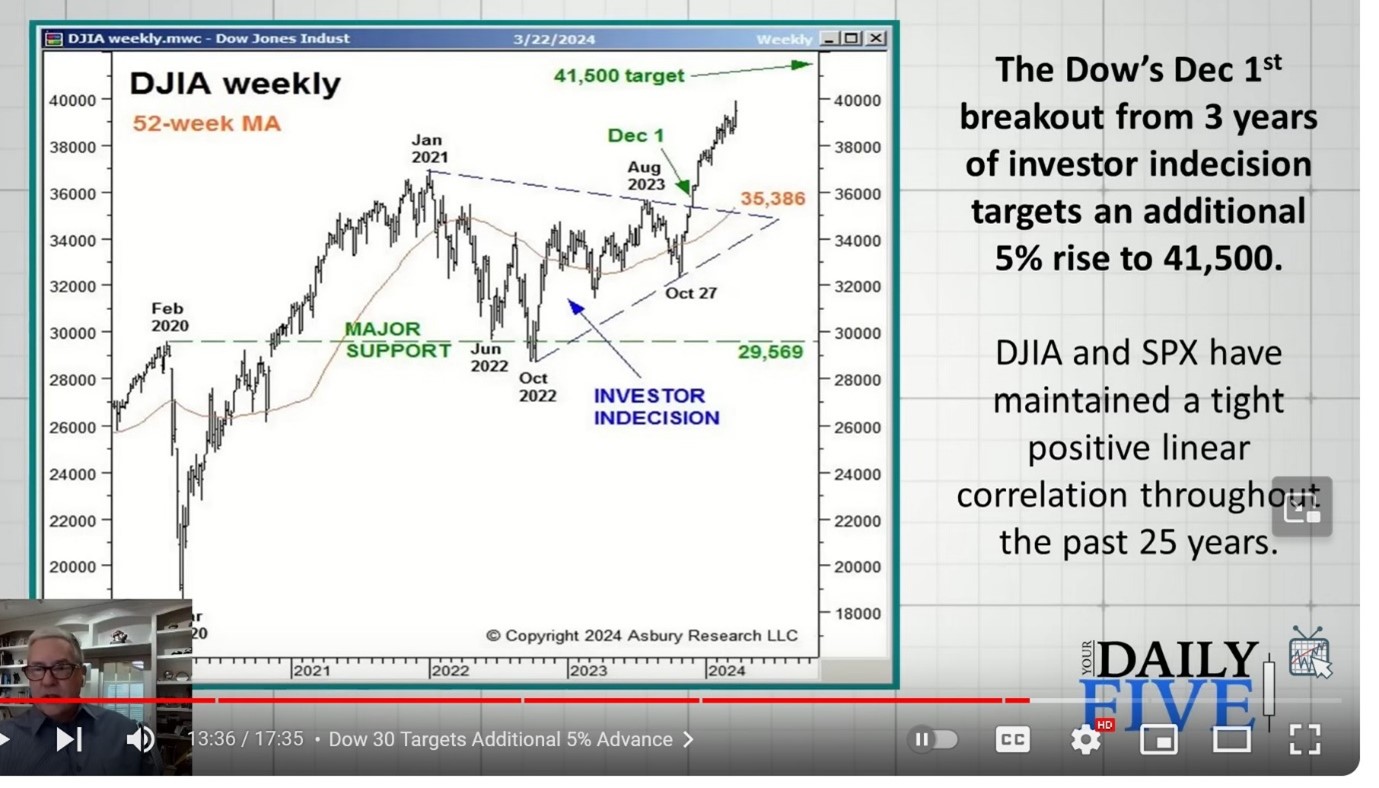
According to Asbury Research the US based Dow Jones Index’s target for the current rally is around 5 per cent higher.
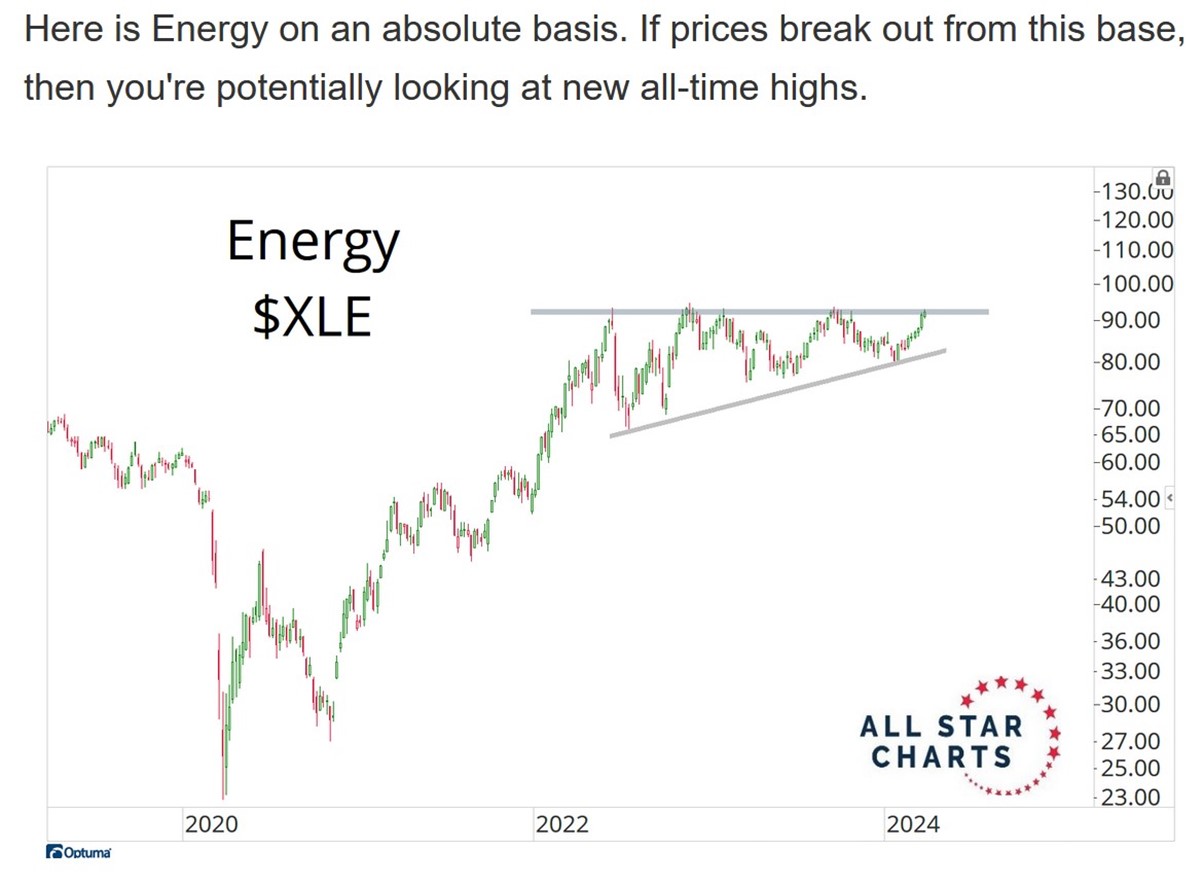
All Star Charts analysts see a possible upcoming break out in the energy sector in the US.
Disclaimer: The commentary on different charts is for general information purposes only and is not an invitation to trade. Trading is risky and individuals should seek Professional counsel before making any financial decisions. Many thanks to Incredible Charts.com software for most of the charts used in the column.
Monitor, measure, manage and maximise… Cheers Charlie.
To order photos from this page click here


