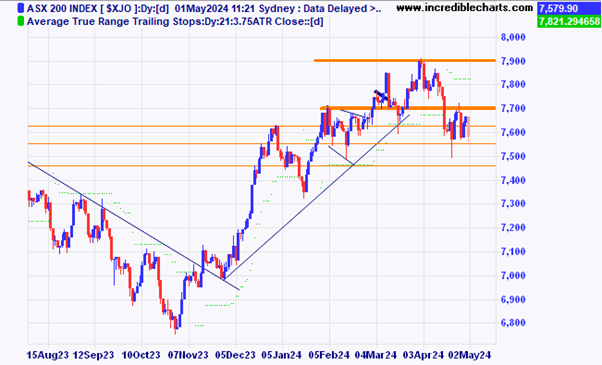
The local market briefly rose to resistance around the 7,700 mark before heading lower. On the plus side it is yet to breach the mid-April low.
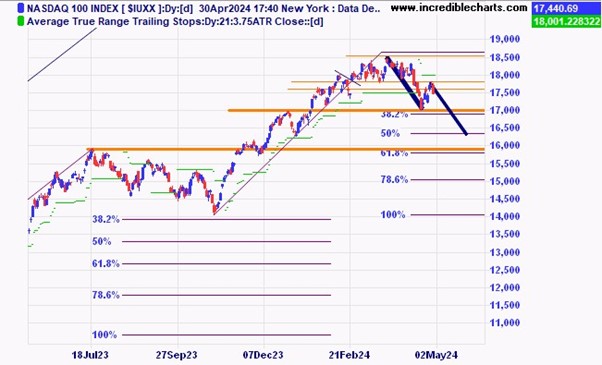
The US based Nasdaq index could be making a corrective ABC type pattern. If the pattern resolves to the downside an equal range target would be around the 16,400 level close to the 50 per cent Fibonacci retracement level.
The price of gold could be making a similar ABC type retracement. Downside target for gold would be around the $2,220 level.

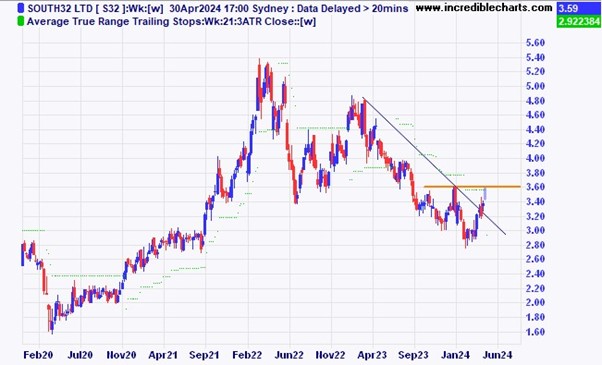
South32 shares are yet to breach stubborn overhead resistance.
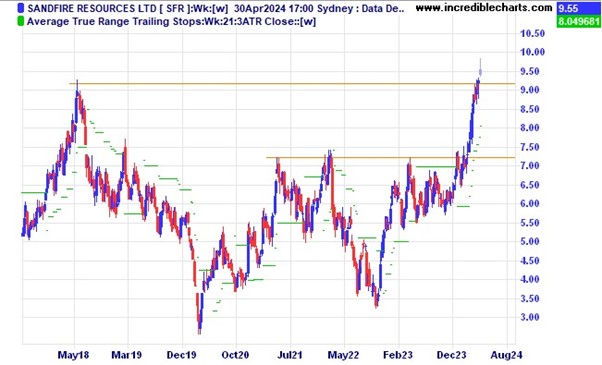
Copper miner Sandfire has moved above the resistance zone for now.
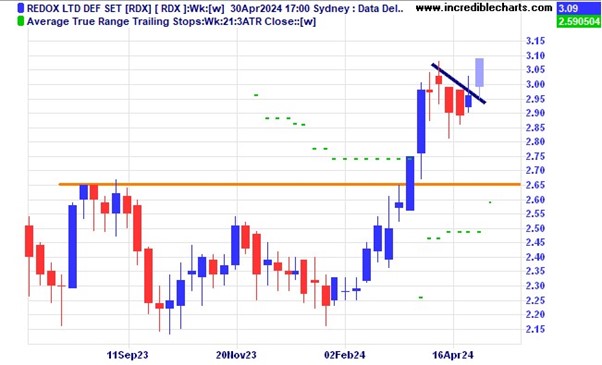
Redox looks to have made a nice bullish flag type pattern and another leg higher could have begun.
Nick Scali has run into some resistance at these levels.

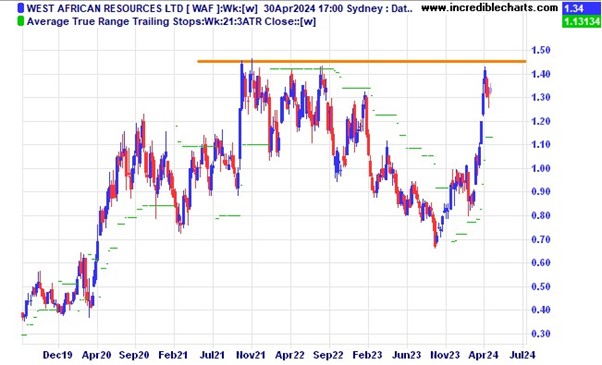
Gold miner West African Resources is again bumping into a resistance zone.
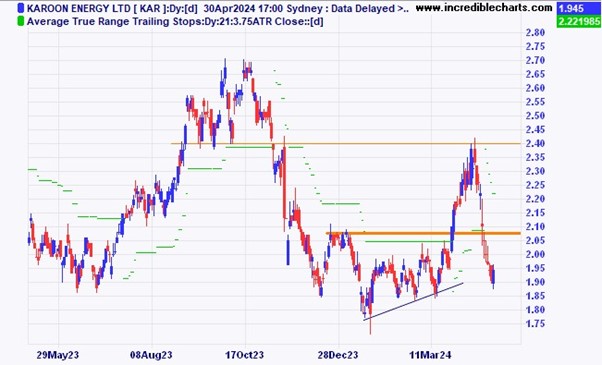
After hitting a resistance zone Karoon Energy has fallen.
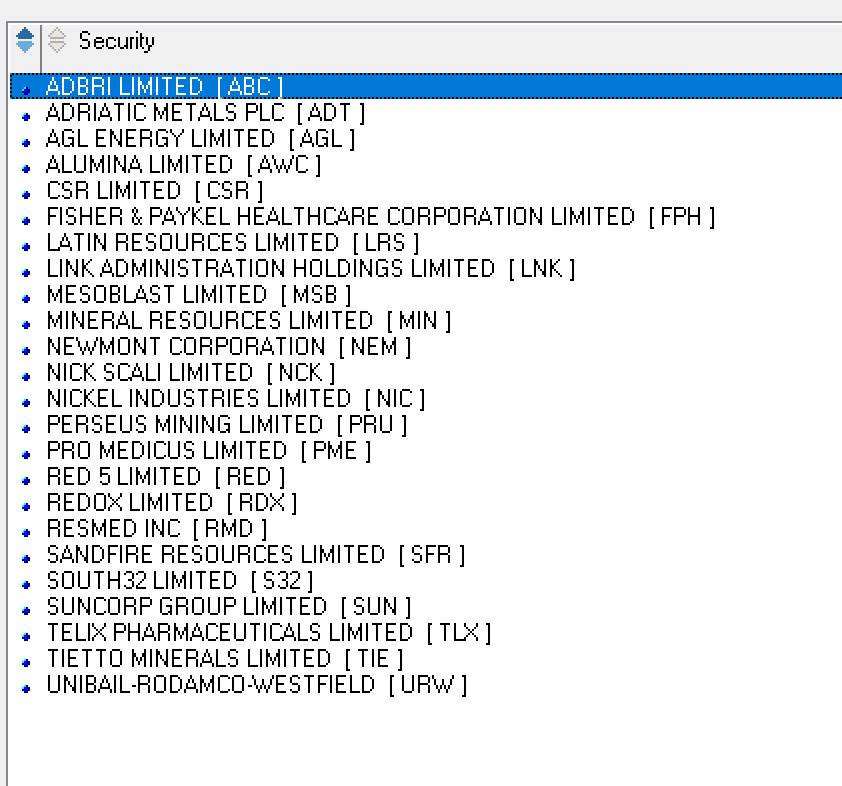
The state of the market in one way can be measured by the number of new 63-day highs increasing or decreasing. After being in the 60’s for a while yesterday’s scan only showed 24 new 63-day highs.
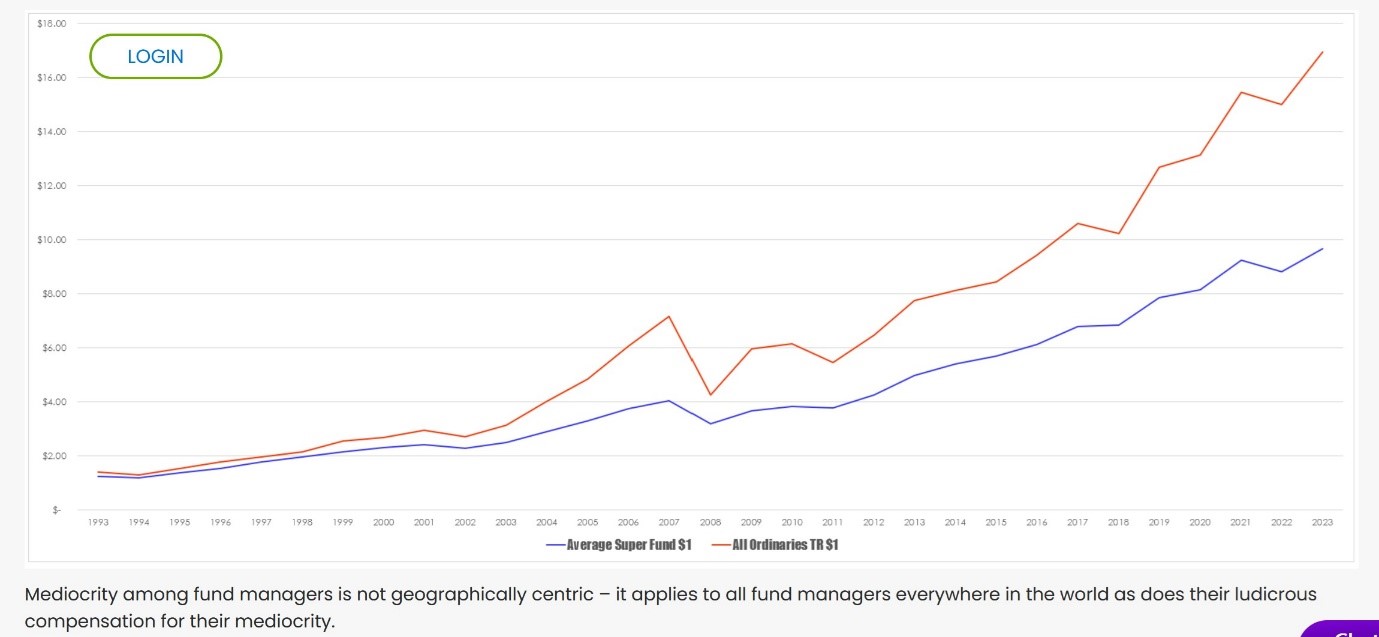
Your Super fund is not the share market. Superannuation funds are sometimes compared to the Australian share market. Super funds hold a number of different asset classes in an aim to smooth returns and lessen volatility. They do not always succeed. This chart shows the average super fund return versus the total return of the All Ordinaries index.
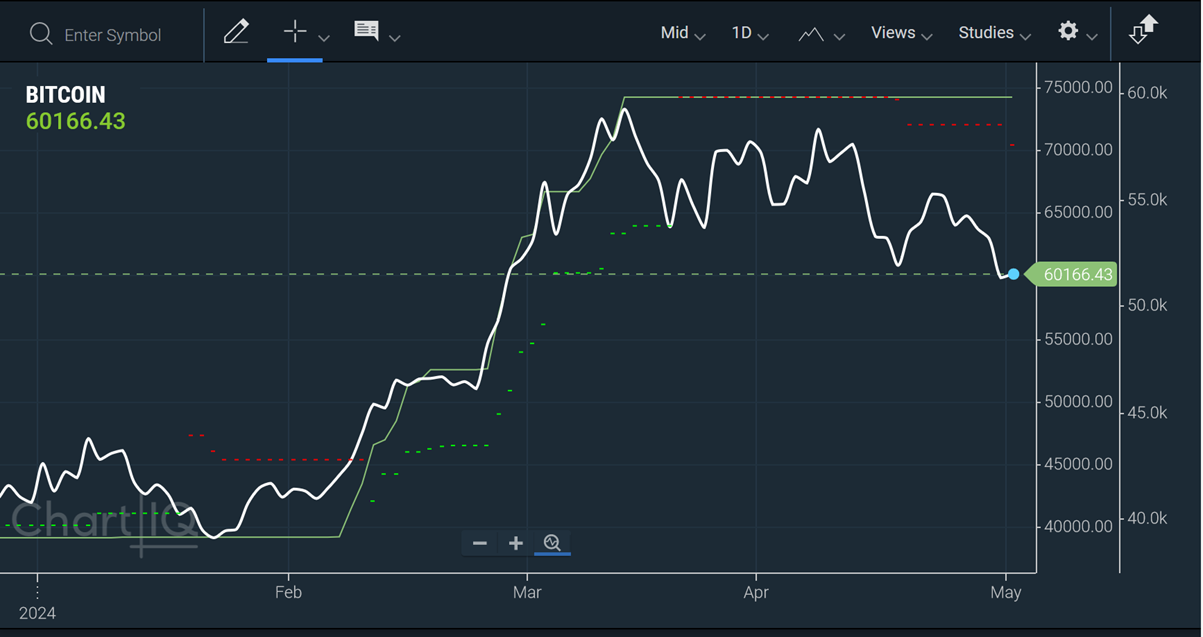
A recent chart of Bitcoin showing a small breach of the recent sideways pattern. How low can it go?
Disclaimer: The commentary on different charts is for general information purposes only and is not an invitation to trade. Trading is risky and individuals should seek Professional counsel before making any financial decisions. Many thanks to Incredible Charts.com software for most of the charts used in the column.
To order photos from this page click here


