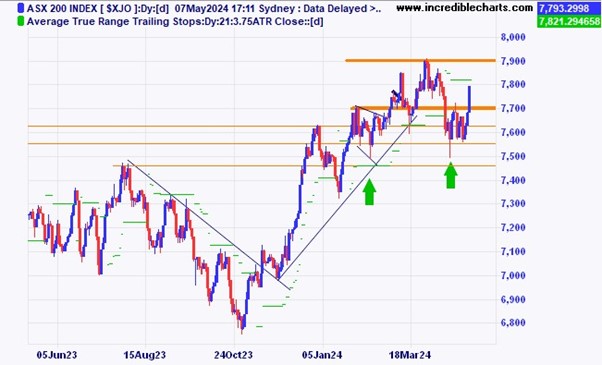
The local market has now made two spikes lower very close to the 7,500 level. Will this rebound make a new high?
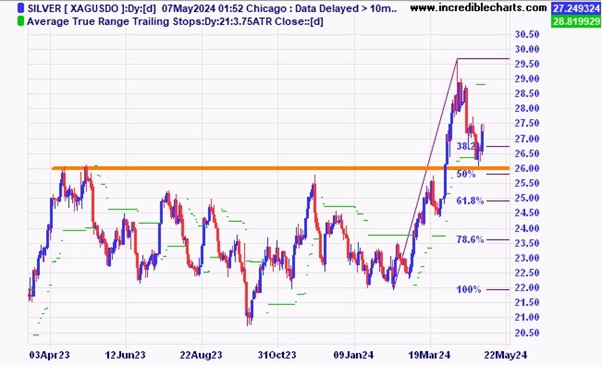
Silver on a daily chart shows a nice rebound off a support/resistance zone. Will that be it or is this just the first leg in an ABC type correction down? Time will tell.
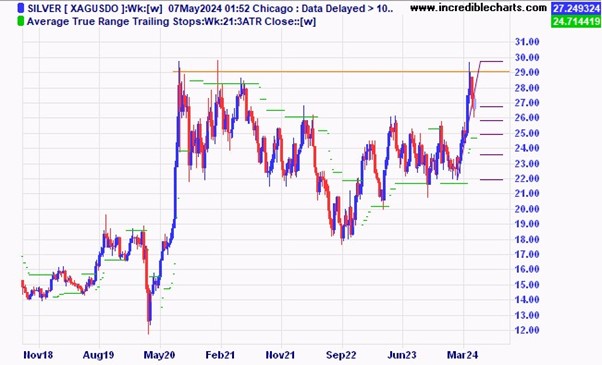
The weekly silver chart shows the different story of price running into long-term resistance.
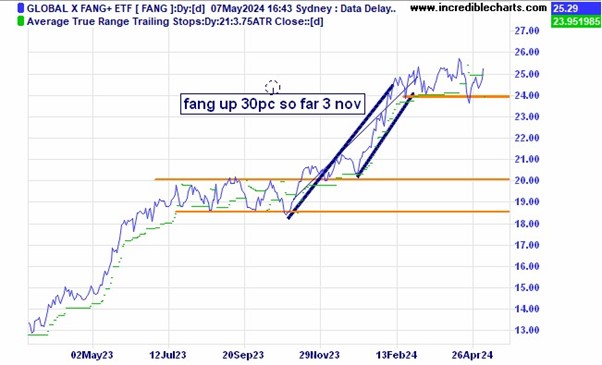
It looks like the locally listed FANG ETF has made a false break lower for now.
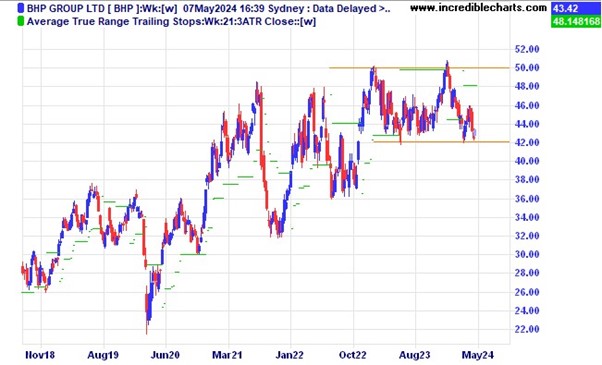
Market heavyweight BHP is languishing near yearly lows.
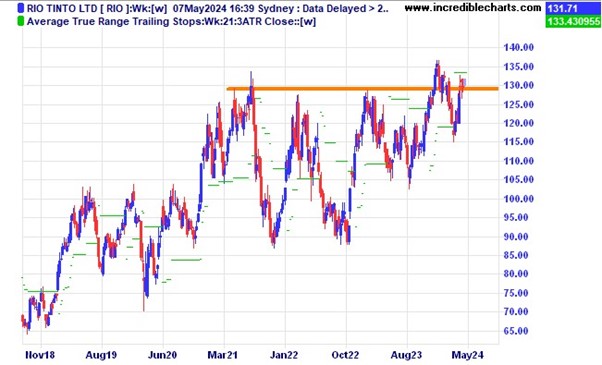
RIO on the other hand is up near the highs.
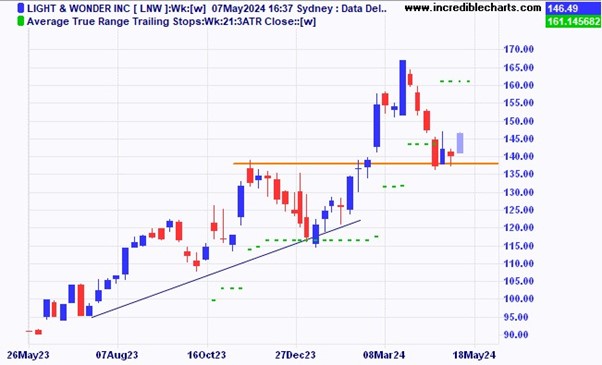
Light and Wonder looks like moving up from here.
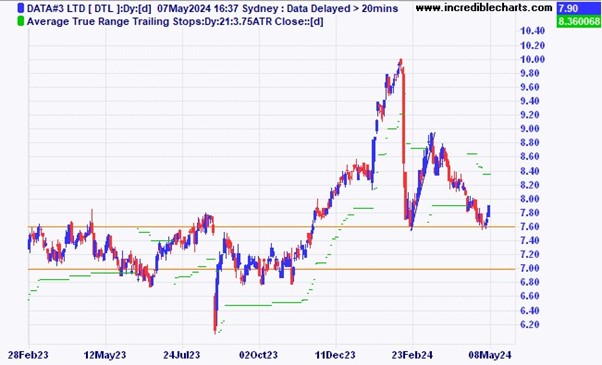
Data#3 is holding support for now. The company recently appeared on a list of longer term compounding of stocks.
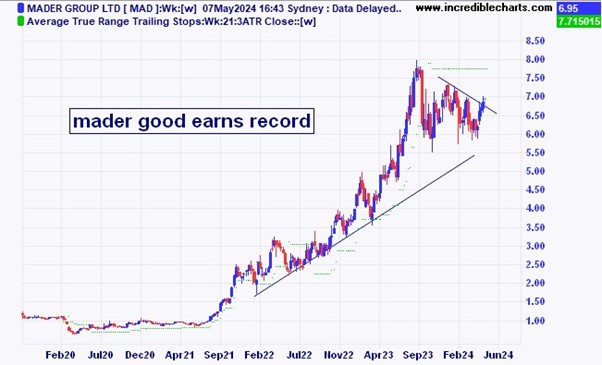
Mader Group could be breaking out of the recent congestion.
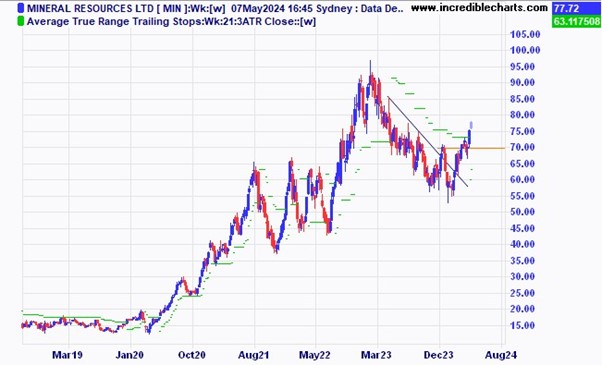
Mineral Resources has made an interesting higher low.
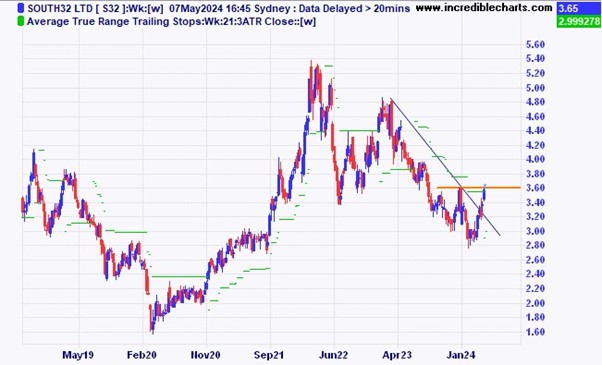
South32 has just nudged above the most recent high.
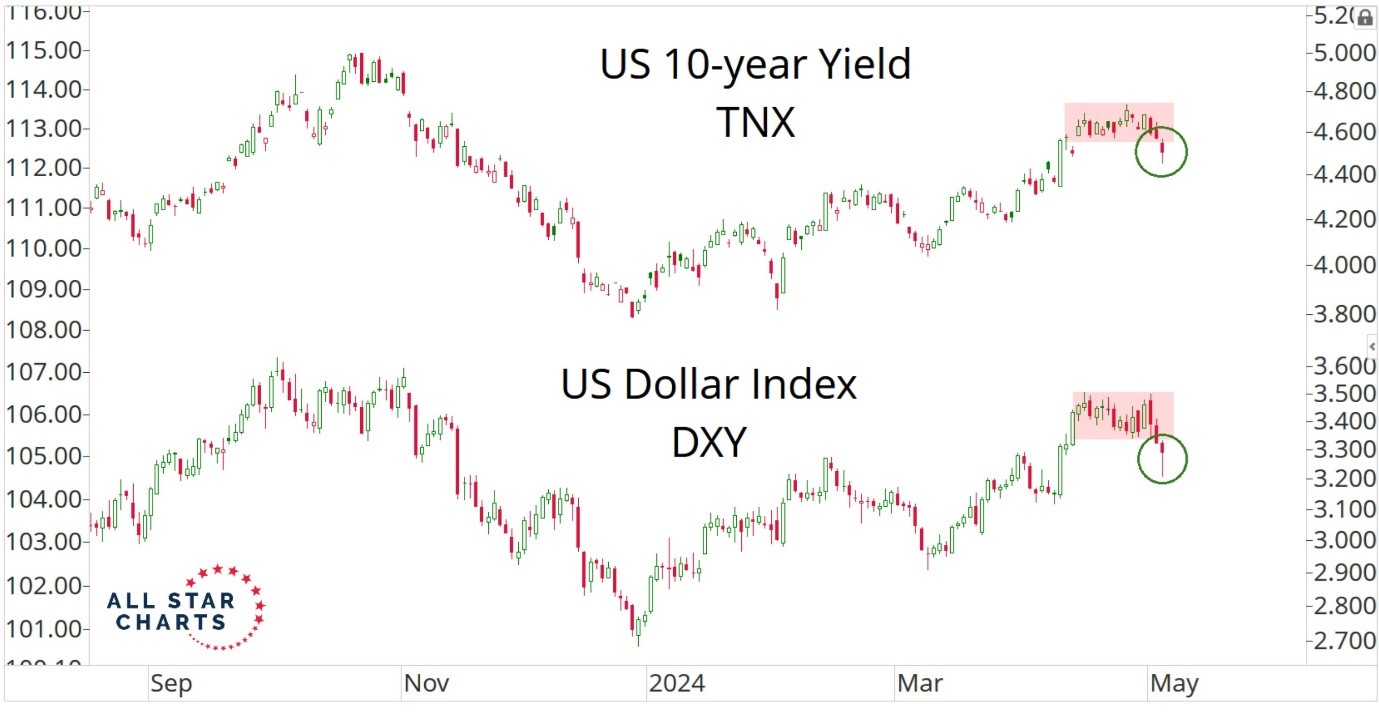
Interesting to see what could be a spike low in the US dollar index and US 10 year bond yield.
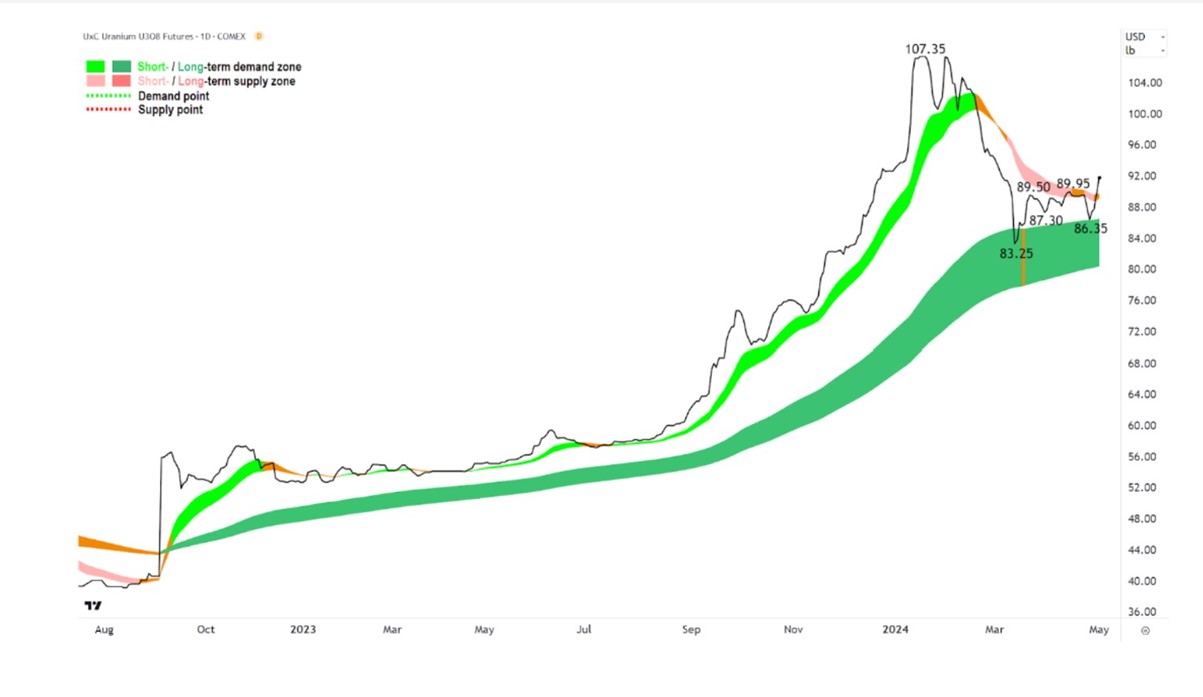
The price of Uranium looks to have moved higher out of the period of consolidation. Australian Uranium stocks were up yesterday.
Disclaimer: The commentary on different charts is for general information purposes only and is not an invitation to trade. Trading is risky and individuals should seek Professional counsel before making any financial decisions. Many thanks to Incredible Charts.com software for most of the charts used in the column.
To order photos from this page click here


