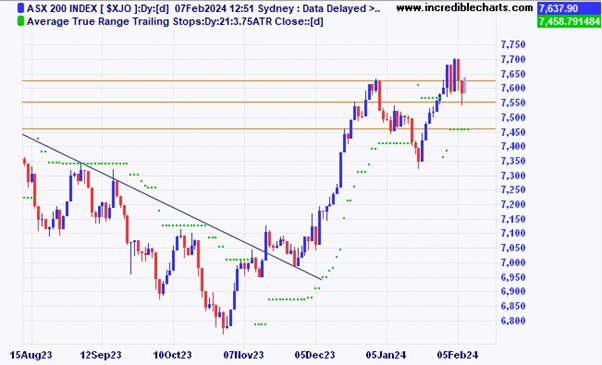
The local market looks to be stuck in a small sideways pattern for now.
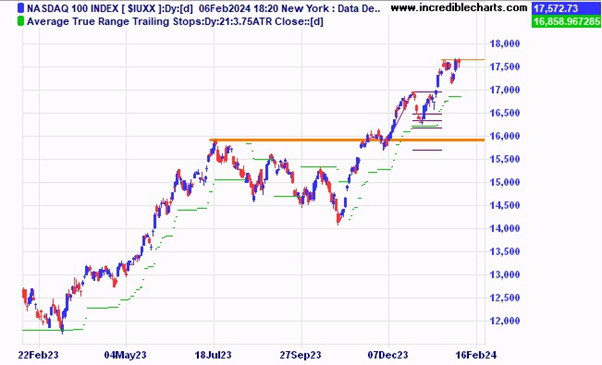
The US based Nasdaq 100 index is making a series of higher lows, how long will this run last?
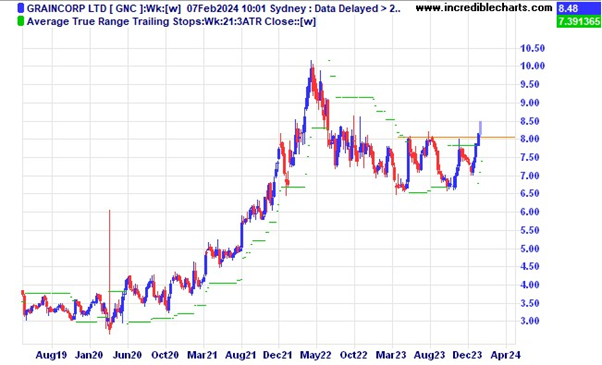
Graincorp has moved above the resistance zone.
Nick Scali jumped after their latest earnings update.

Telix keeps stalling around these levels, can it finally breakthrough?

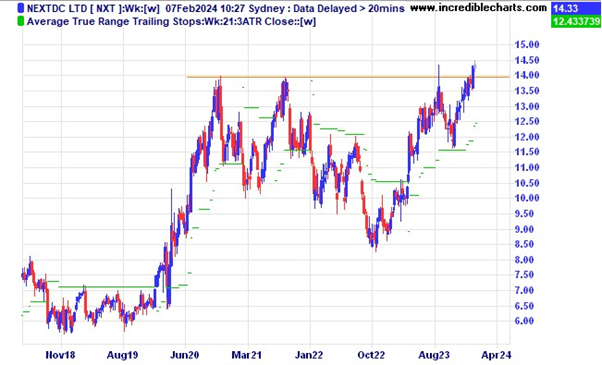
NextDC on the cusp of making new highs.
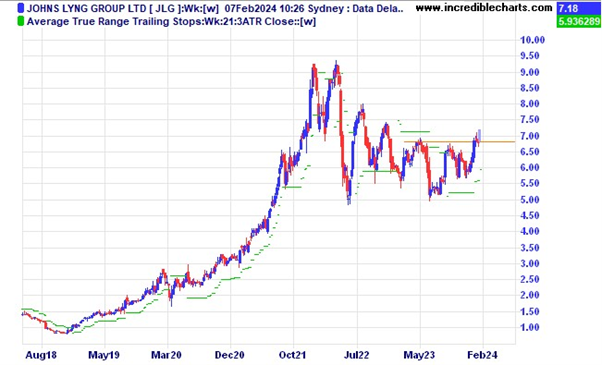
Can Johns Lyng Group keep pushing ahead?
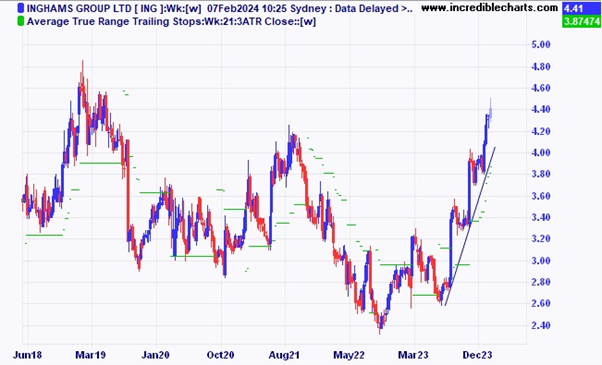
Inghams Group has been rising quickly over the past few months.
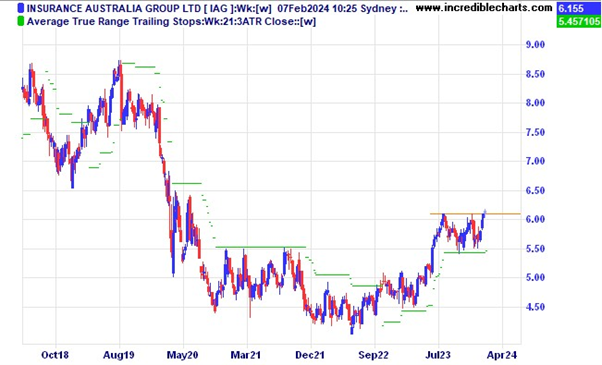
Insurance Australia Group looks close to breaking above the resistance zone.
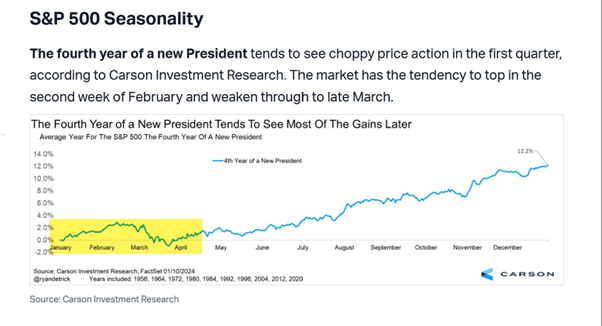
Another seasonal look at what generally happens over the course of an election year in the US S@P 500 market.
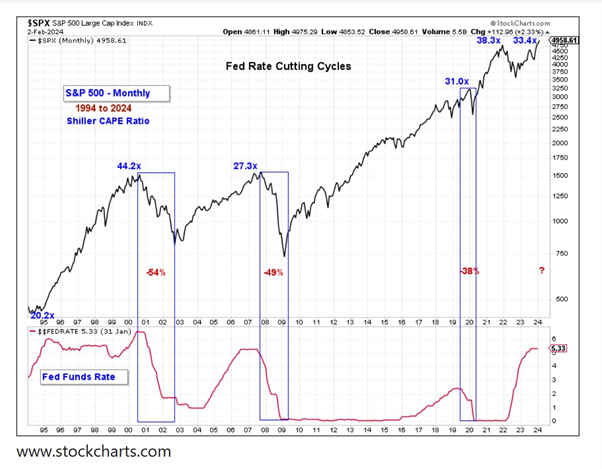
A look at rate cutting cycles since the market peak in 2000. Not the best thing for the stock market looking at these examples.
Disclaimer: The commentary on different charts is for general information purposes only and is not an invitation to trade. Trading is risky and individuals should seek Professional counsel before making any financial decisions. Many thanks to Incredible Charts.com software for most of the charts used in the column.
Monitor, measure, manage and maximise… Cheers Charlie.
To order photos from this page click here


